Justin Perry
NAILSMA
23 November 2021
Defining metrics of success for feral animal management in northern Australia
There are an estimated 24 million feral pigs in Australia and despite numerous efforts to control them throughout previous decades, their populations have continued to increase and leave wetland destruction in their wake.
The Queensland Department of Environment and Science had identified pig damage as a major issue but until this Northern Hub project, impacts of pig damage on specific wetland types had not been quantified.
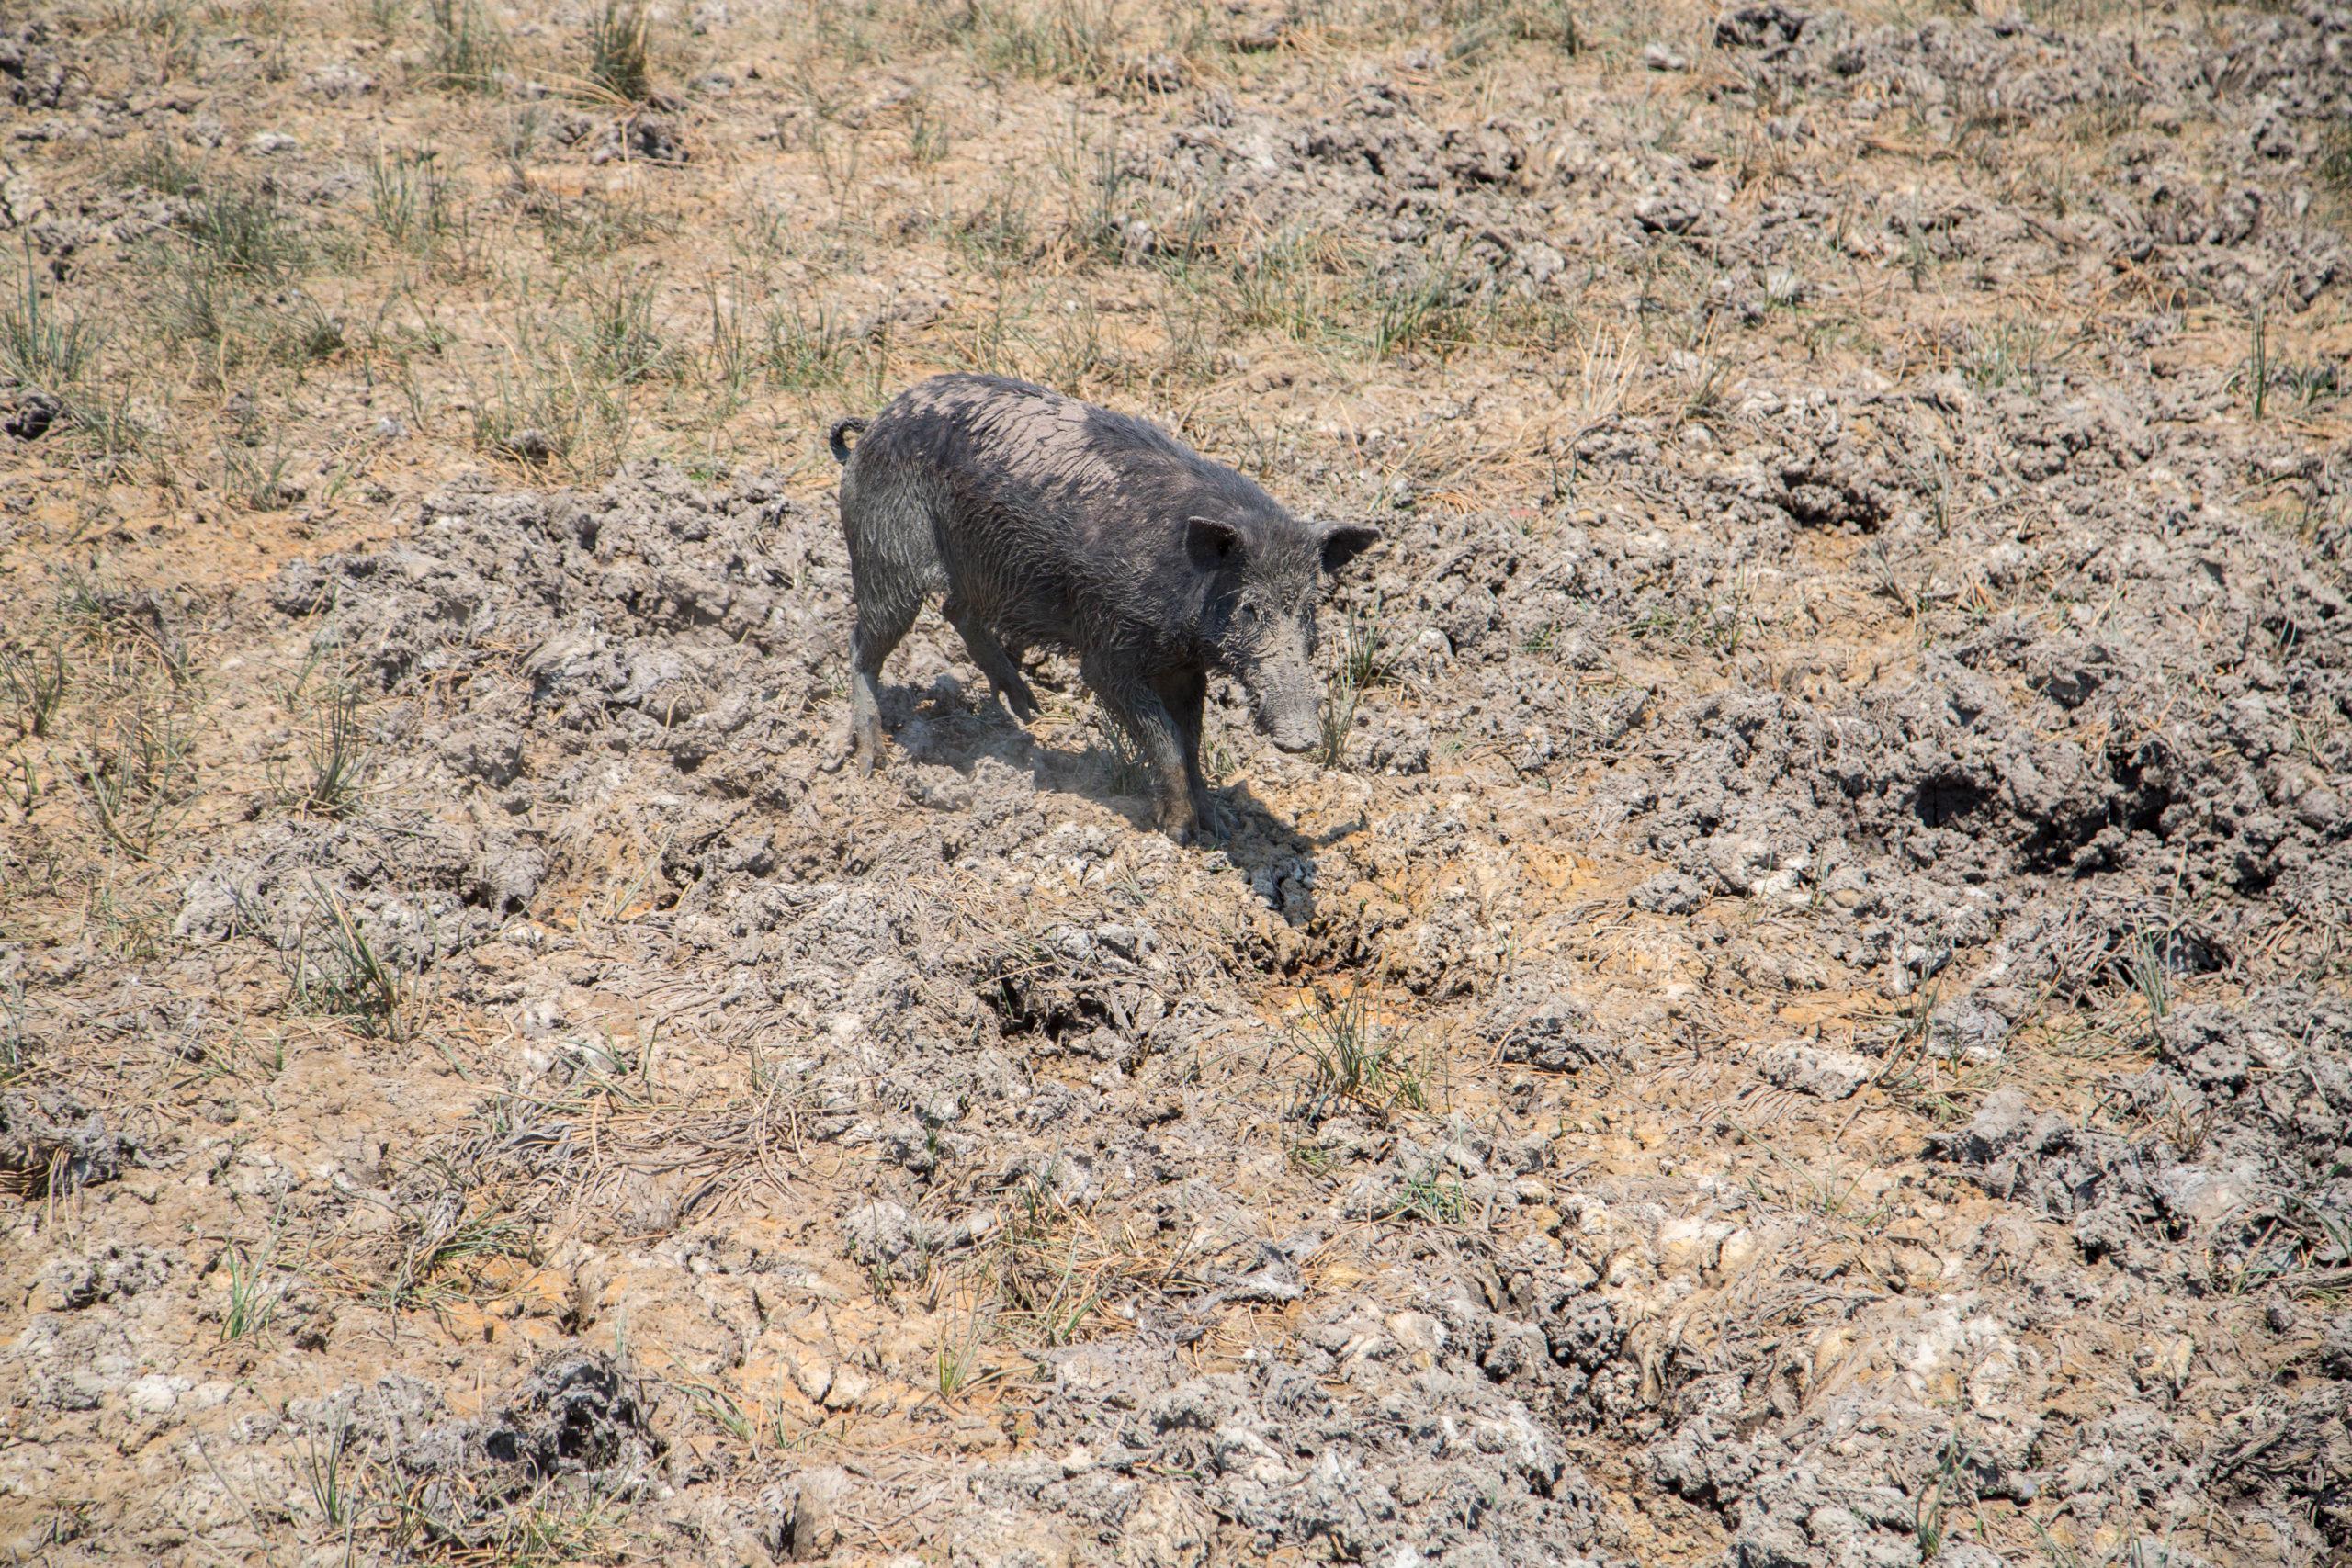
Feral pigs cause damage in numerous ways in and on the margins of wetlands. Photo: Samantha Setterfield.
To understand the effects of pigs on different wetlands, researchers first needed to improve the definitions of what makes one wetland different to another. These wetland typologies can then support the modelling of feral pig data and incorporate cultural values which are not always adequately considered when managing feral pigs.
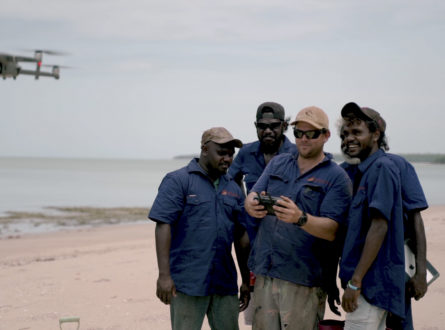
Dr Justin Perry led a team of ecologists, human geographers, Traditional Owners and land managers who generated improved wetland typologies, developed a baseline data set for the Archer River basin, quantified types and extent of pig damage, assessed the value of fencing wetlands and compiled all this data using artificial intelligence.
The scientists, land managers and rangers from CSIRO, James Cook University, the Queensland Department of Environment and Science, Kalan Enterprises and Aak Puul Ngantam Cape York further built on the updated wetland typologies to create an interactive dashboard that can help inform effective, robust and ongoing feral species control programs.
Using the typology, rangers and other land managers can identify the different types of wetlands in their management area and then use repeatable management and monitoring strategies to reduce the impact of feral pigs on important ecological and cultural wetland sites.
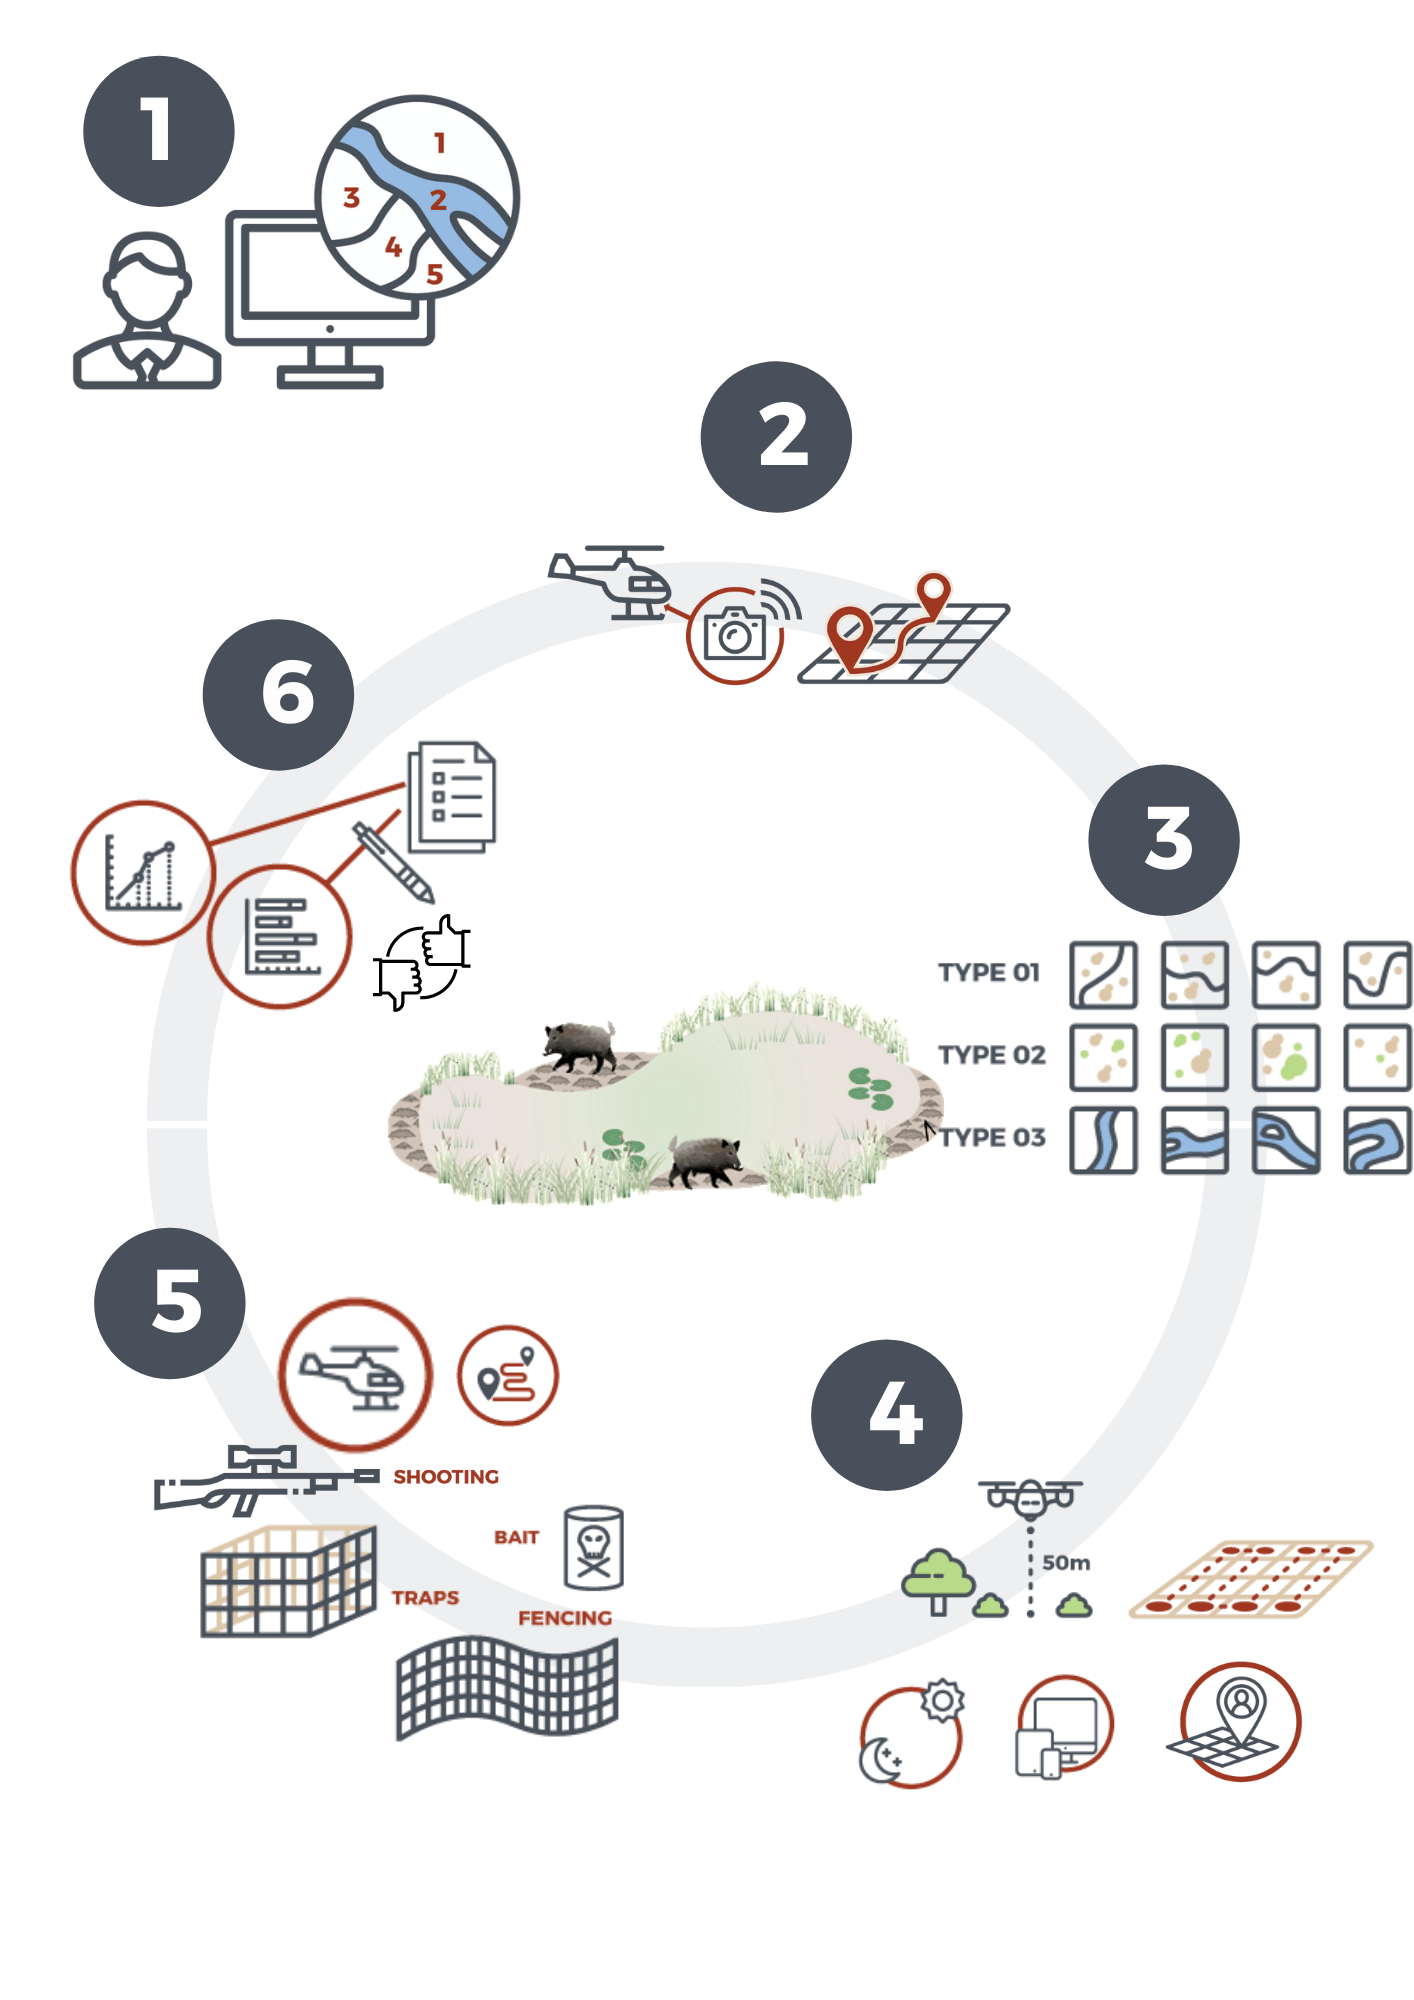
Infographic showing suggested use of the methods discussed in the report. We suggest an adaptive management approach where baseline information is derived and then sites are monitored annually to report changes.
The interactive dashboard provides a system that can be extended and modified by users to input and visualise the data. It enables cost-benefit analysis of control methods to compare investment against impacts, which supports better decision-making for land managers.
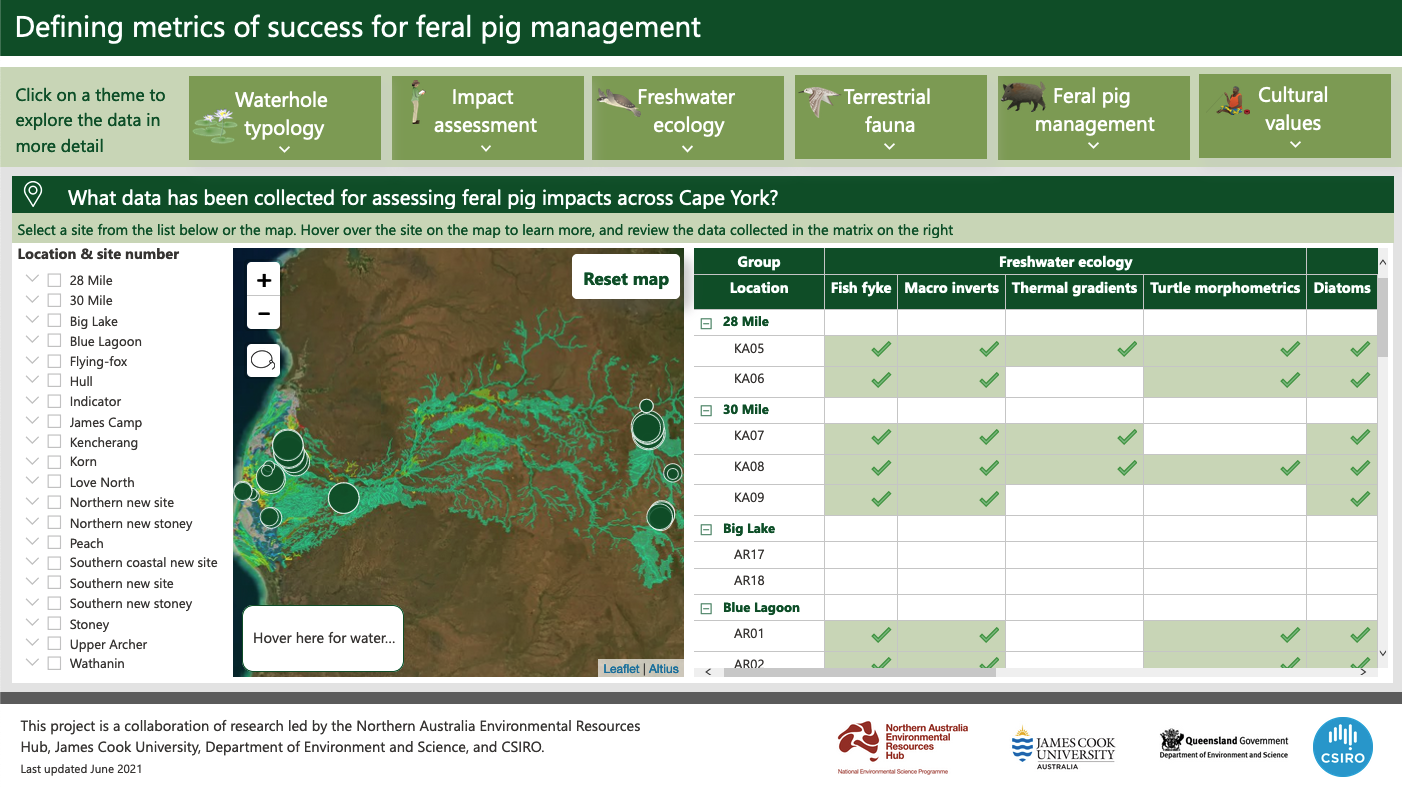
The Power BI dashboard visually summarises large datasets so that rangers and other land managers can make informed decisions about the best management options. Photo: NESP Northern Australia Environmental Resources Hub.
To discover more detail about the findings of this project, head to the project page or read the final report.
NAILSMA
Key Researcher
DESI (Queensland Government)
DES (Queensland)
James Cook University
DES (Queensland)
Want to know more about the Resilient Landscapes Hub's activities and our research into practical solutions to environmental problems? Stay informed about activities, research, publications, events and more through the Hub newsletter.
"*" indicates required fields