Natalie Stoeckl
Key researcher
University of Tasmania
22 August 2022
Accurately characterising these systems is becoming increasingly important to holistically manage biodiversity and natural resources. However, data to adequately describe these systems is lacking, and it is prohibitively expensive to collect enough data to describe all aspects of the systems in detail.
It is important to think strategically about how to use the information we do have and prioritise the collection of new data.
There are various frameworks that describe relationships between humans and nature in a connected human–nature system. As part of the Socioeconomic insights for resilient landscapes project, we analysed these frameworks for their use in natural-resource management, their typical outputs, the capitals (resources) considered and the flow of benefits. Read the full report on this work.
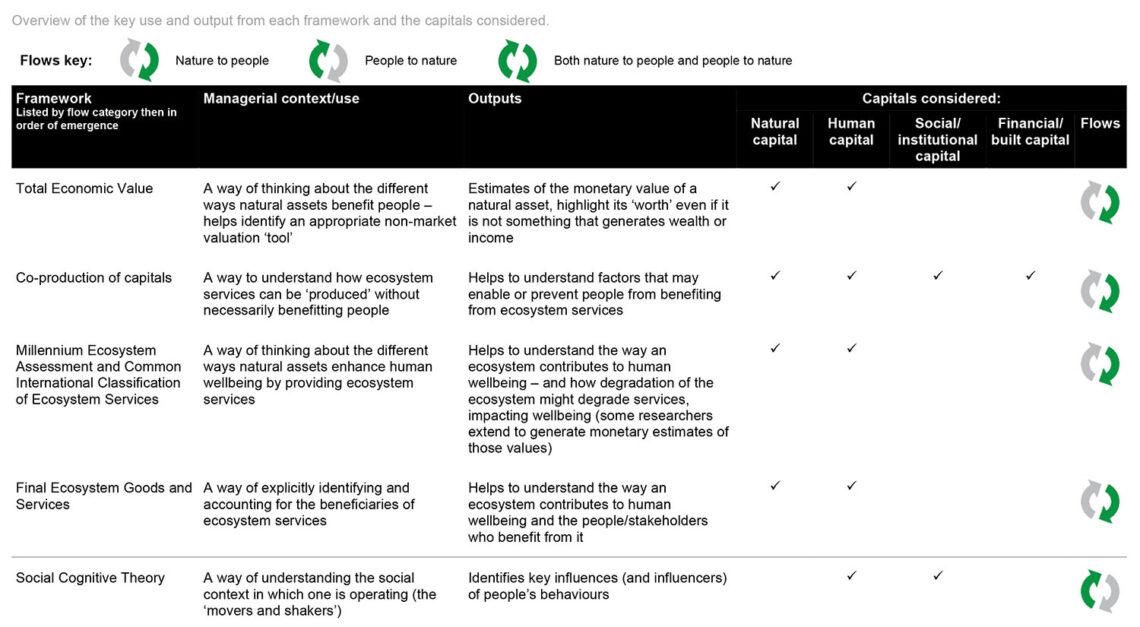
Overview of the key use and output from each framework and the capitals considered. The full table is available in this stand-alone PDF and in the report.
We used these insights to identify and describe the ‘ideal’ dataset needed to adequately support natural-resource managers in different situations, and to improve the information that is available for policy-makers to generate better human–nature outcomes.
The frameworks focused on relationships between nature and people – both good and bad – and are relevant to different problems. The frameworks highlighted the broad range of data required to adequately support resource managers – the ‘wish list’ of data needs.
We used the wish list as a guide to search for relevant Australian data. We then compared the wish list with our compilation to identify data gaps. Not all frameworks are relevant to all practical or policy problems, so data gaps are more relevant to some problems than others. We outlined ways of using our compiled dataset and designed a conceptual model explaining our pathway to producing our wish-list dataset and how it can facilitate improved environmental policy outcomes (see figure below).
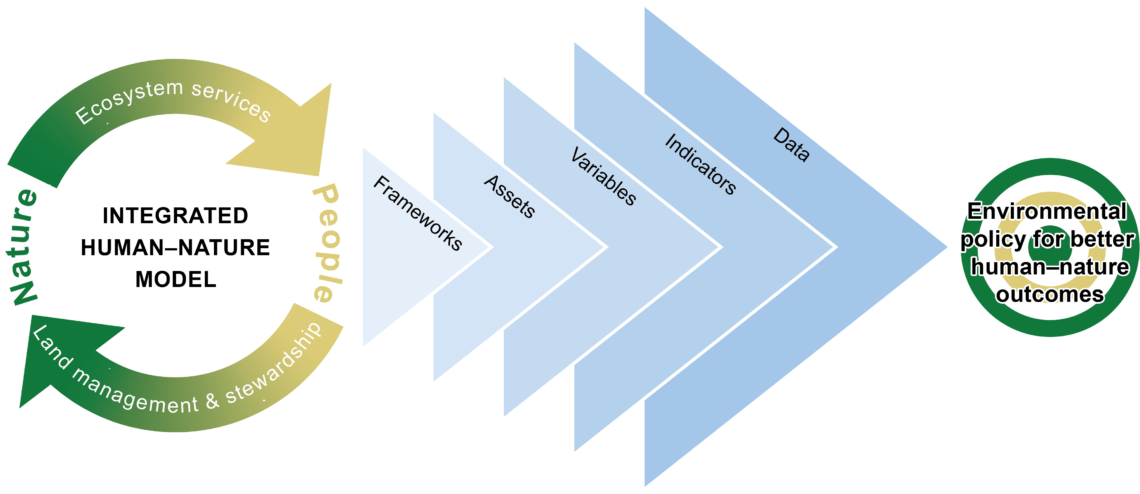
An integrated human–nature model helps us to derive insights from frameworks to determine the selection of indicators to guide environmental policy for better human and nature outcomes. Image: Resilient Landscapes Hub.
To accurately describe the reciprocal and connected human–nature system, it is not enough to only consider the socioeconomic and natural characteristics of the system. Additional variables that may also need to be considered include:
Most decision-makers who seek to improve human–nature outcomes will need data that describes a broad range of capitals, such as human capital (e.g. population density), social/institutional capital (e.g. land tenure), financial/built capital (e.g. economic participation) and natural capital (e.g. forests), as well as the interactions between them.
Many frameworks describe both the extent of capitals (e.g. number of people, types of forests) and their status (e.g. people’s age and income, forest extent and health). It is also important to include other measures that describe broader contextual factors (e.g. the social and economic environment in which people live, the climatic conditions in which forests live).
In addition to describing the current state of the system, processes of change and interventions that have the potential to create change also need to be considered. This may include variables that are indicators of change (to various capitals) or predictors of outcomes of management interventions.
Significant data gaps include the relative scarcity of data describing core human and social/institutional capitals. Detailed data requirements will vary by context, including the particulars of the problem to be addressed, the scale of the problem to be addressed and the stakeholders involved.
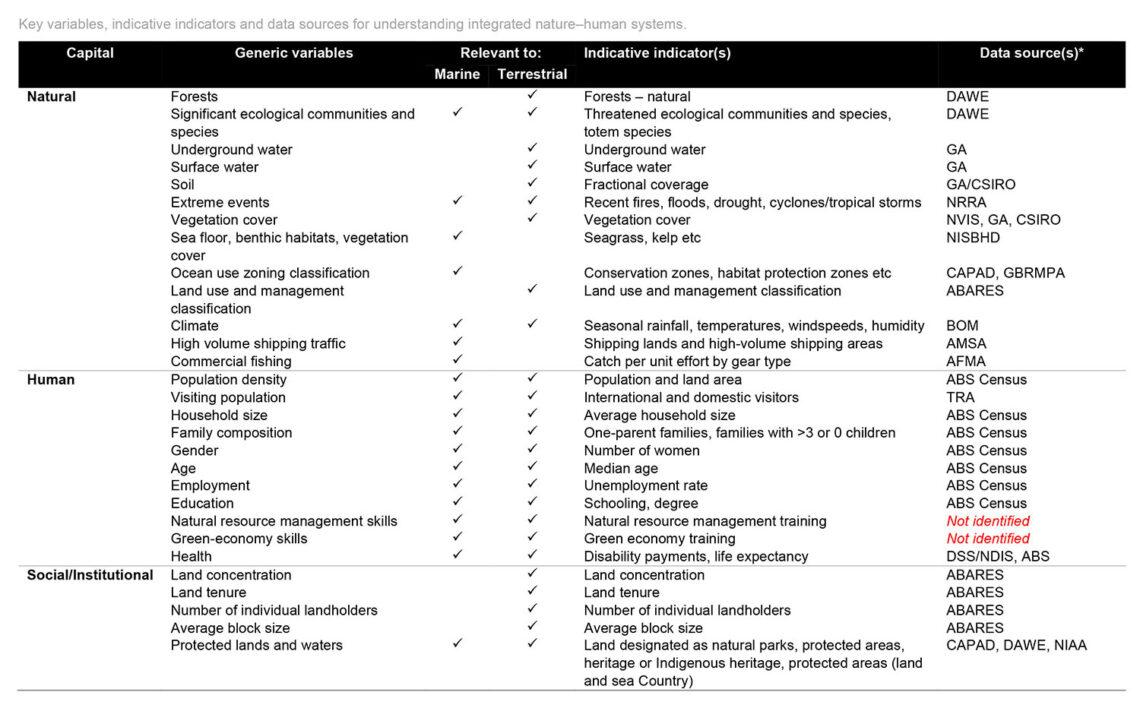
Key variables, indicative indicators and data sources for understanding integrated human–nature systems. The full table is available in this stand-alone PDF and in the report.
Funds allocated to research, planning and on-ground environmental action must be spent cost effectively to achieve the best outcomes for ecosystems and biodiversity. This means translating knowledge across regions in sensible ways, using the available evidence to build the most impactful environmental programs.
Our integrated dataset lays the foundations for doing just that. It consistently describes areas across Australia using metrics that can be compared and analysed to identify regions that share similar attributes. It provides resource managers with social, economic and biophysical background across Australia that is both useful and contextual.
Our dataset and the supporting information within this report provide a platform that can be used in subsequent investigations to:
We are working to add additional variables to our dataset that relate to climate, water, aquatic biodiversity and threatened species. We will then analyse the data to identify groups of regions that share similar social, economic and biophysical characteristics. We will also be able to identify regions that share similar characteristics to important places such as protected areas and priority places identified in the Threatened Species Strategy Action Plan 2021–2026, and to identify regions that have characteristics most suited to particular planning approaches.
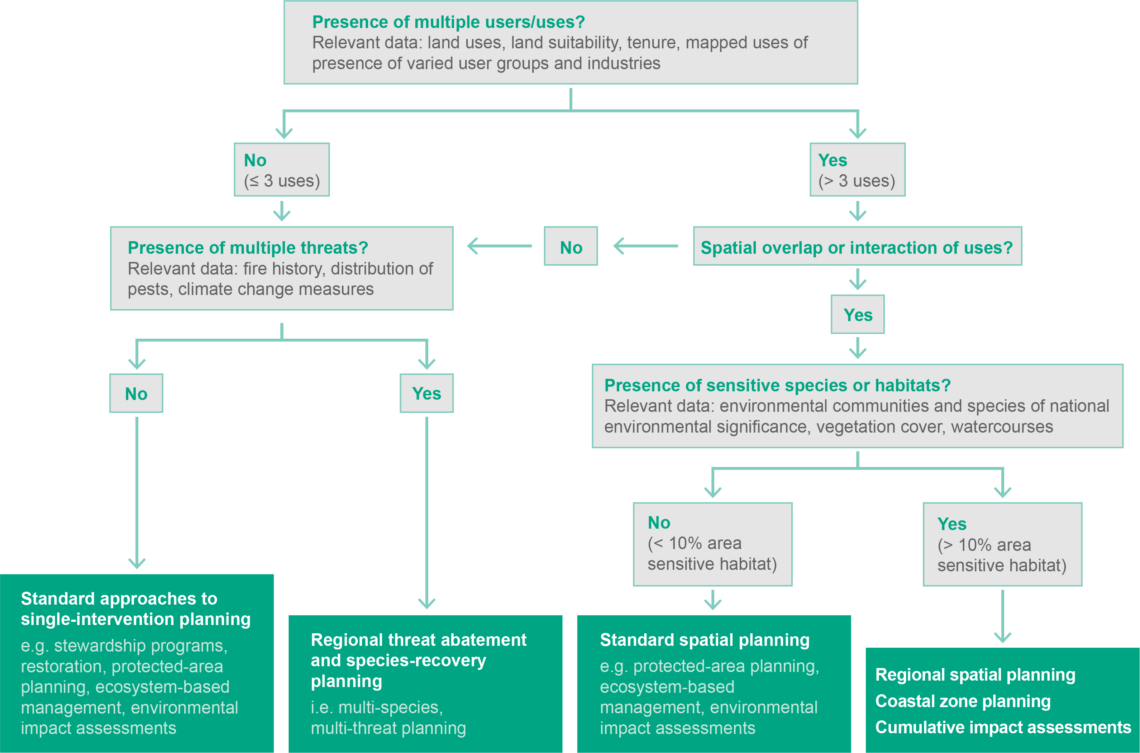
This regional-planning decision tree can be used with the compiled dataset to help planners choose the right plan for the right place. For more information on these approaches, see this news post. Image: Resilient Landscapes Hub.
Want to know more about the Resilient Landscapes Hub's activities and our research into practical solutions to environmental problems? Stay informed about activities, research, publications, events and more through the Hub newsletter.
"*" indicates required fields