This successful collaboration between researchers and government has produced over 1500 maps of threatening processes, species’ distribution and species’ vulnerability to extinction.
These maps are already being integrated into government workflows to deliver conservation outcomes across the north.
This project is responding to the increasing pressure for agricultural expansion and other development across northern Australia by generating maps of ‘conservation concern’ species, threatening processes and species’ vulnerability to threatening processes, that are relevant at this scale and finer scales. Though the project is not yet complete, the research is already starting to inform development and conservation planning and prioritisations through, for example, protected area evaluation and investment, strategic regional assessments, catchment level development guidance, land rehabilitation and several research projects. In doing so it is helping to achieve biodiversity outcomes across northern Australia and beyond.
This project is helping to achieve biodiversity outcomes across northern Australia and beyond.

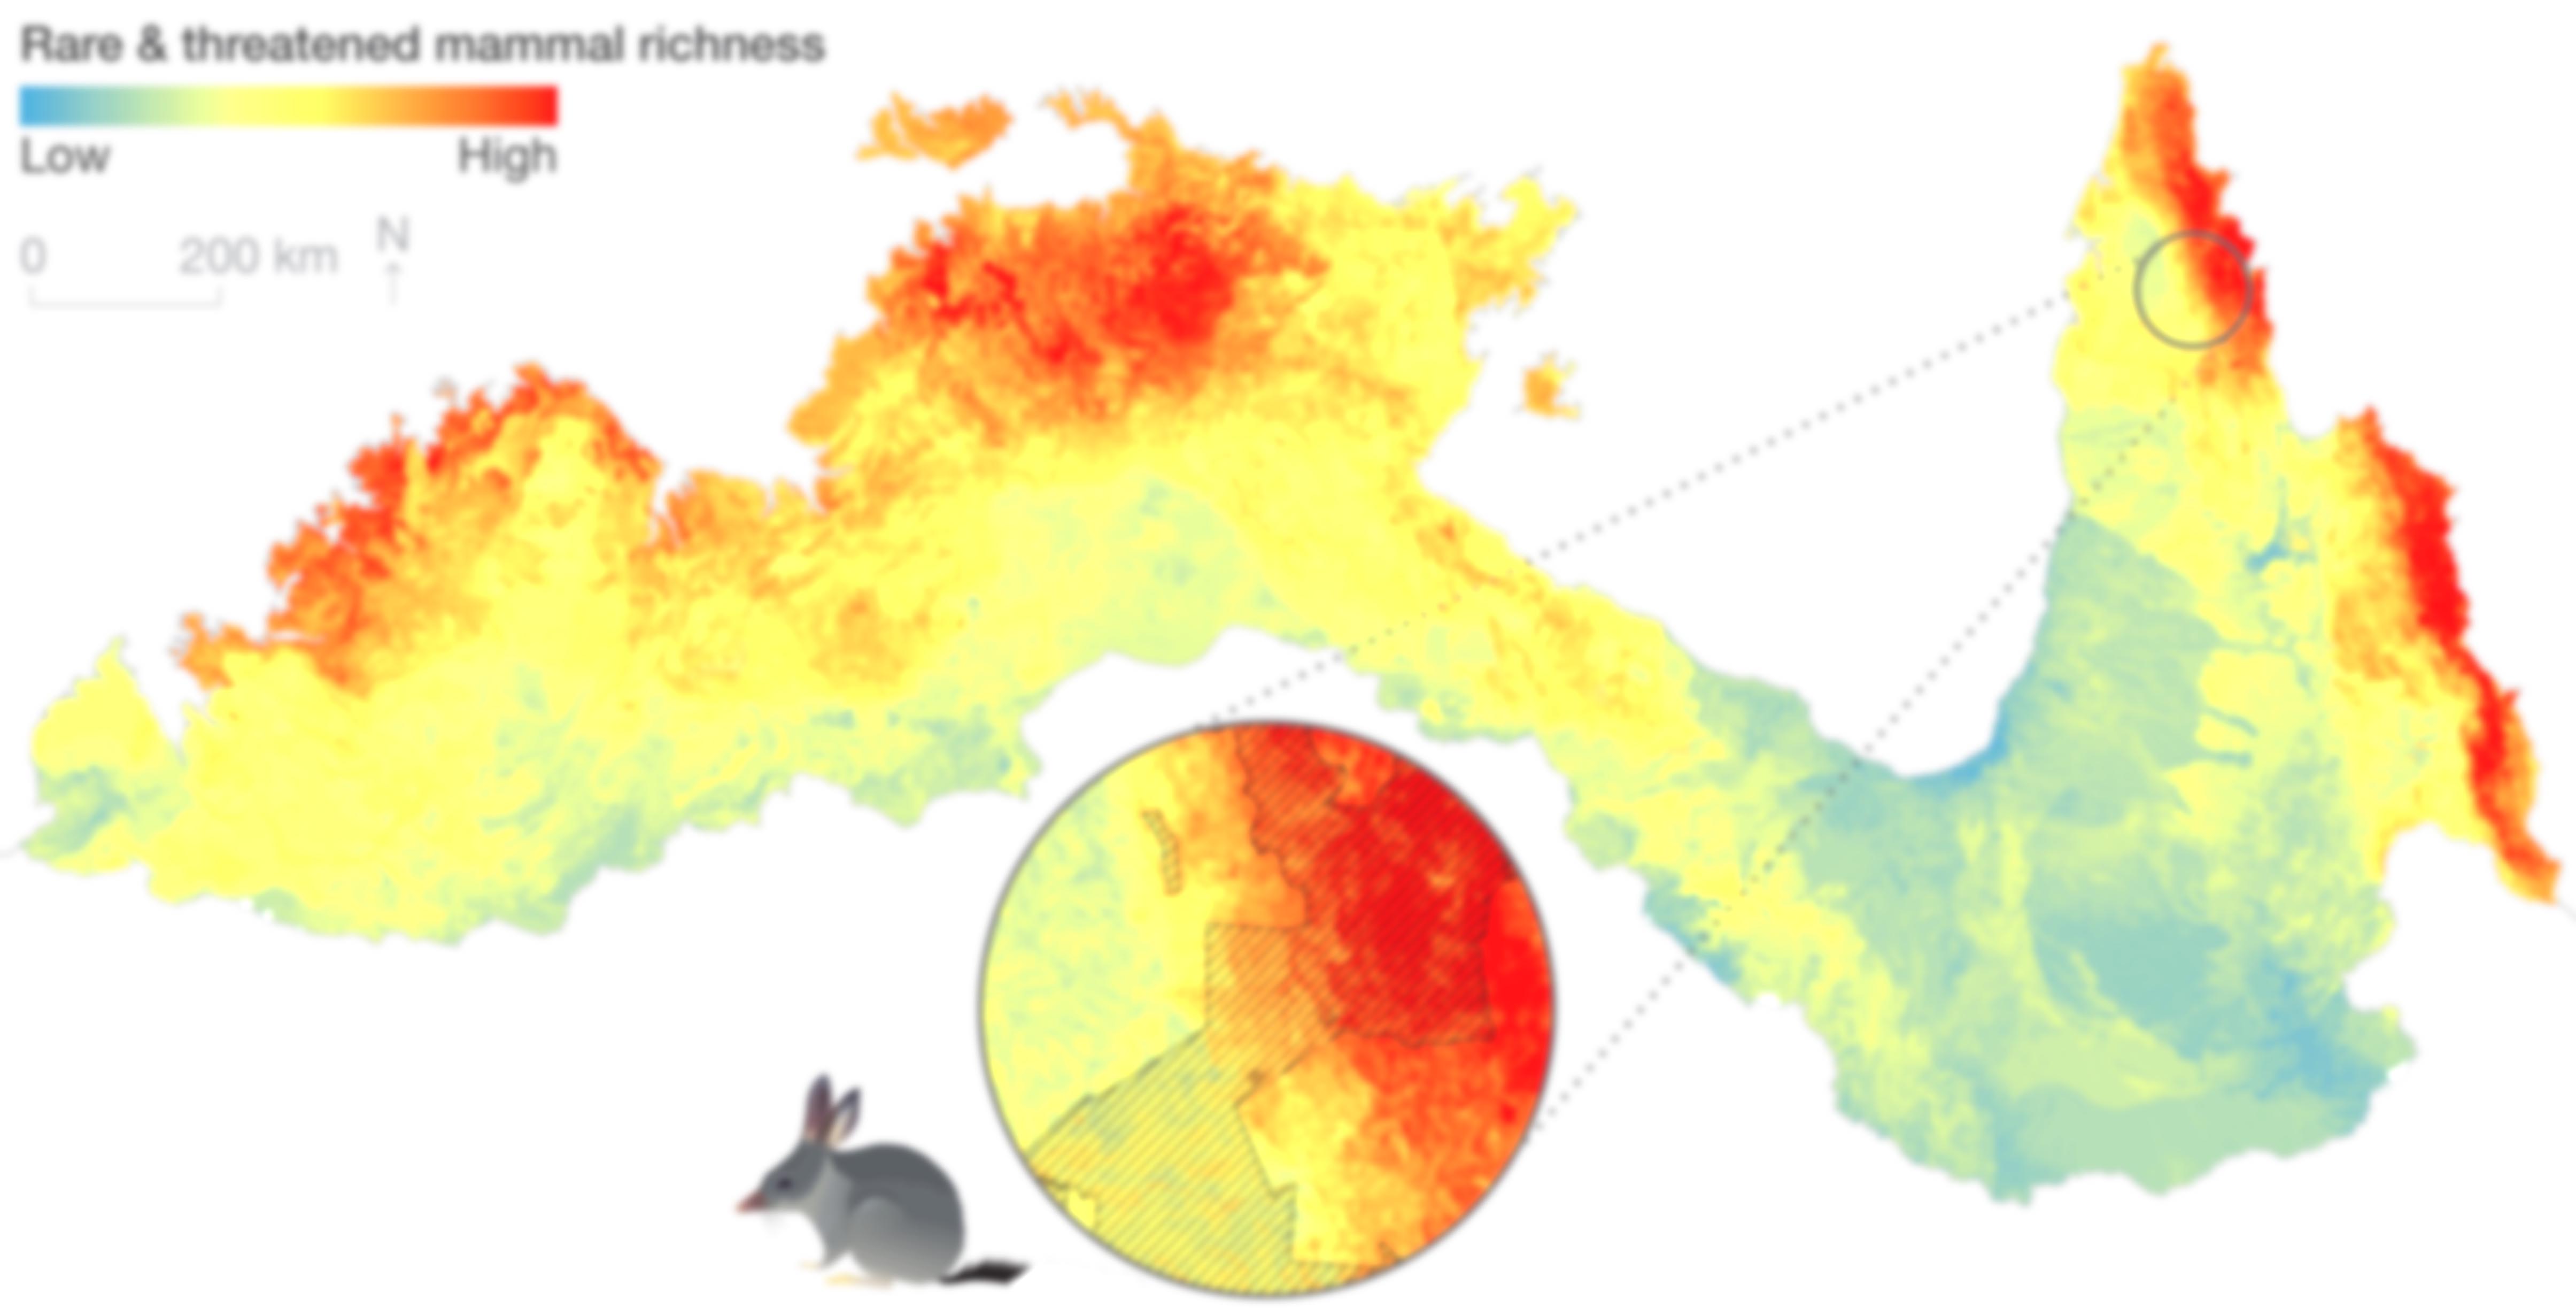
Example of one of the mapping outputs from the project.
The examples below show how the project is having an impact.
Staff in Queensland’s Department of Environment and Science are using the project’s spatial data layers for multiple purposes, such as to investigate the extent to which current Protected Areas reflect the locations of biodiversity hotspots and vulnerable species, where to best acquire new properties, and conservation values at property scale.
In the near future they plan to use the maps, especially the threat maps and species sensitivity maps, to guide on-ground management activities. Adding to the project’s benefits, researchers and department staff are also using the maps to co-develop a system to report biodiversity losses that have been avoided thanks to initiatives such as environmentally sensitive development planning.
Staff regard the models that the researchers used to generate the maps as ‘best practice’ and want to use these across the state to continue to progress the activities above. A senior staff member here attested:
To date the NESP Northern Hub data has been invaluable for incorporating priority species matters into assessing the performance of Queensland’s protected area system, prioritising expansion of the protected area system, and assessing properties and sites for potential conservation values. Moving forward we expect to be using this information, particularly with the NESP threat mapping and species sensitivities, to guide investment in management activities to maximise conservation outcomes. We also view the Northern Hub methodology as best practise for estimating species and threat distributions…. We will be looking to find resources and/or create partnerships to apply these methods throughout Queensland.
– Senior staff member from Queensland’s Department of Environment and Science

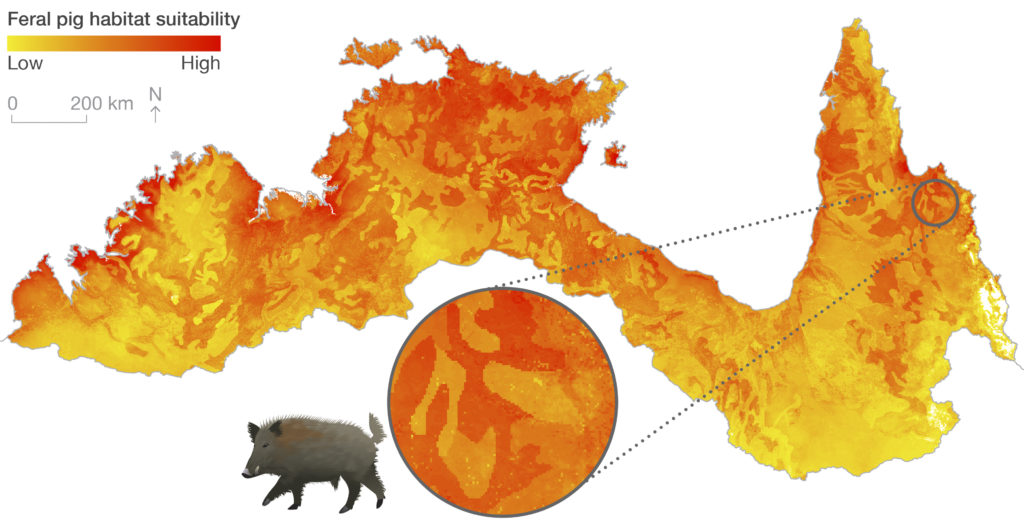
Feral pig habitat suitability in northern Australia mapping output.
The project is also contributing to significant work funded by the Department of Climate Change, Energy, the Environment and Water. Through the co-chaired Physical Environment Analysis Network, a CSIRO project is applying Hub data sets to agricultural development scenarios in four river catchments in the Darwin region as part of the Sustainable Regional Development (Northern Australia) project.
This work builds on significant government investment in improving knowledge of agricultural resources (e.g. soils, land suitability, water availability) and aims to now consider environmental factors in its analyses to guide development.
To achieve this goal, NESP outputs will be used to overview biodiversity and threatened species and these map layers will be integrated with other data sets (e.g. Australian Bureau of Statistics datasets) to address key questions related to northern development. There’s also potential for the project data and integration techniques used here to be applied in other parts of Australia.

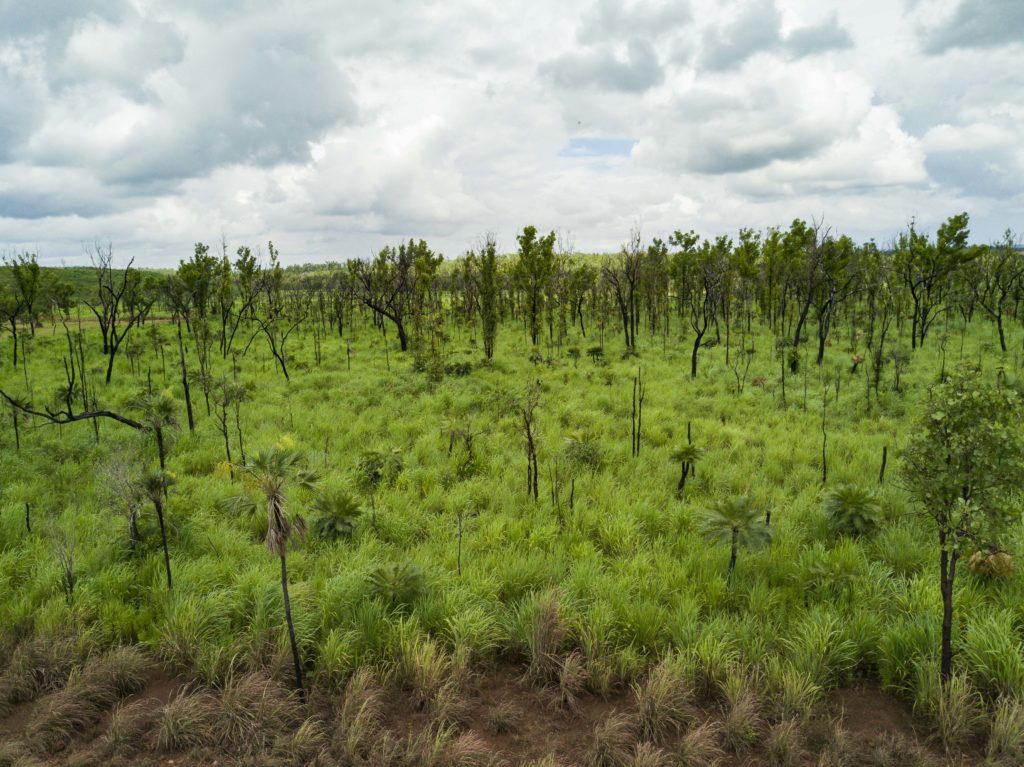
Gamba is a weed of national significance that transforms northern Australian landscapes. Photo by NESP Northern Hub.
Other major Australian Government projects such as the Geological and Bioregional Assessments, and the Natural Capital Accounting in the Primary Industries, may also use the maps for supporting sustainable development in northern Australia and beyond:
It looks like it is a very useful piece of work. I’d expect that your work could be potentially quite impactful.
– CSIRO Team Leader, March 2019
The work is well supported by the Department of Climate Change, Energy, the Environment and Water’s Environmental Resources Information Network (ERIN) staff who have been engaged with the project from its outset.
Comments from a key user here include:
It’s provided some real tangible outputs for us. We’re getting ahead of the game. Another exciting aspect is for us to learn new species distribution modelling techniques.
– Key user from the Department of Climate Change, Energy, the Environment and Water’s Environmental Resources Information Network (ERIN)
ERIN are reviewing outputs from the project with a view to incorporating the data into their species distribution modelling which supports decision-making under the Environment Protection and Biodiversity Conservation Act.
Finally, the maps and related analyses have informed research and conservation of Wet Tropics plants (Australian Tropical Herbarium), threatened birds (PhD research) and invasive deer (PhD research), and more requests for spatial data have been received for other research purposes.
As the project wraps up, we’re looking forward to promoting the maps more broadly to scale up these already significant impacts!

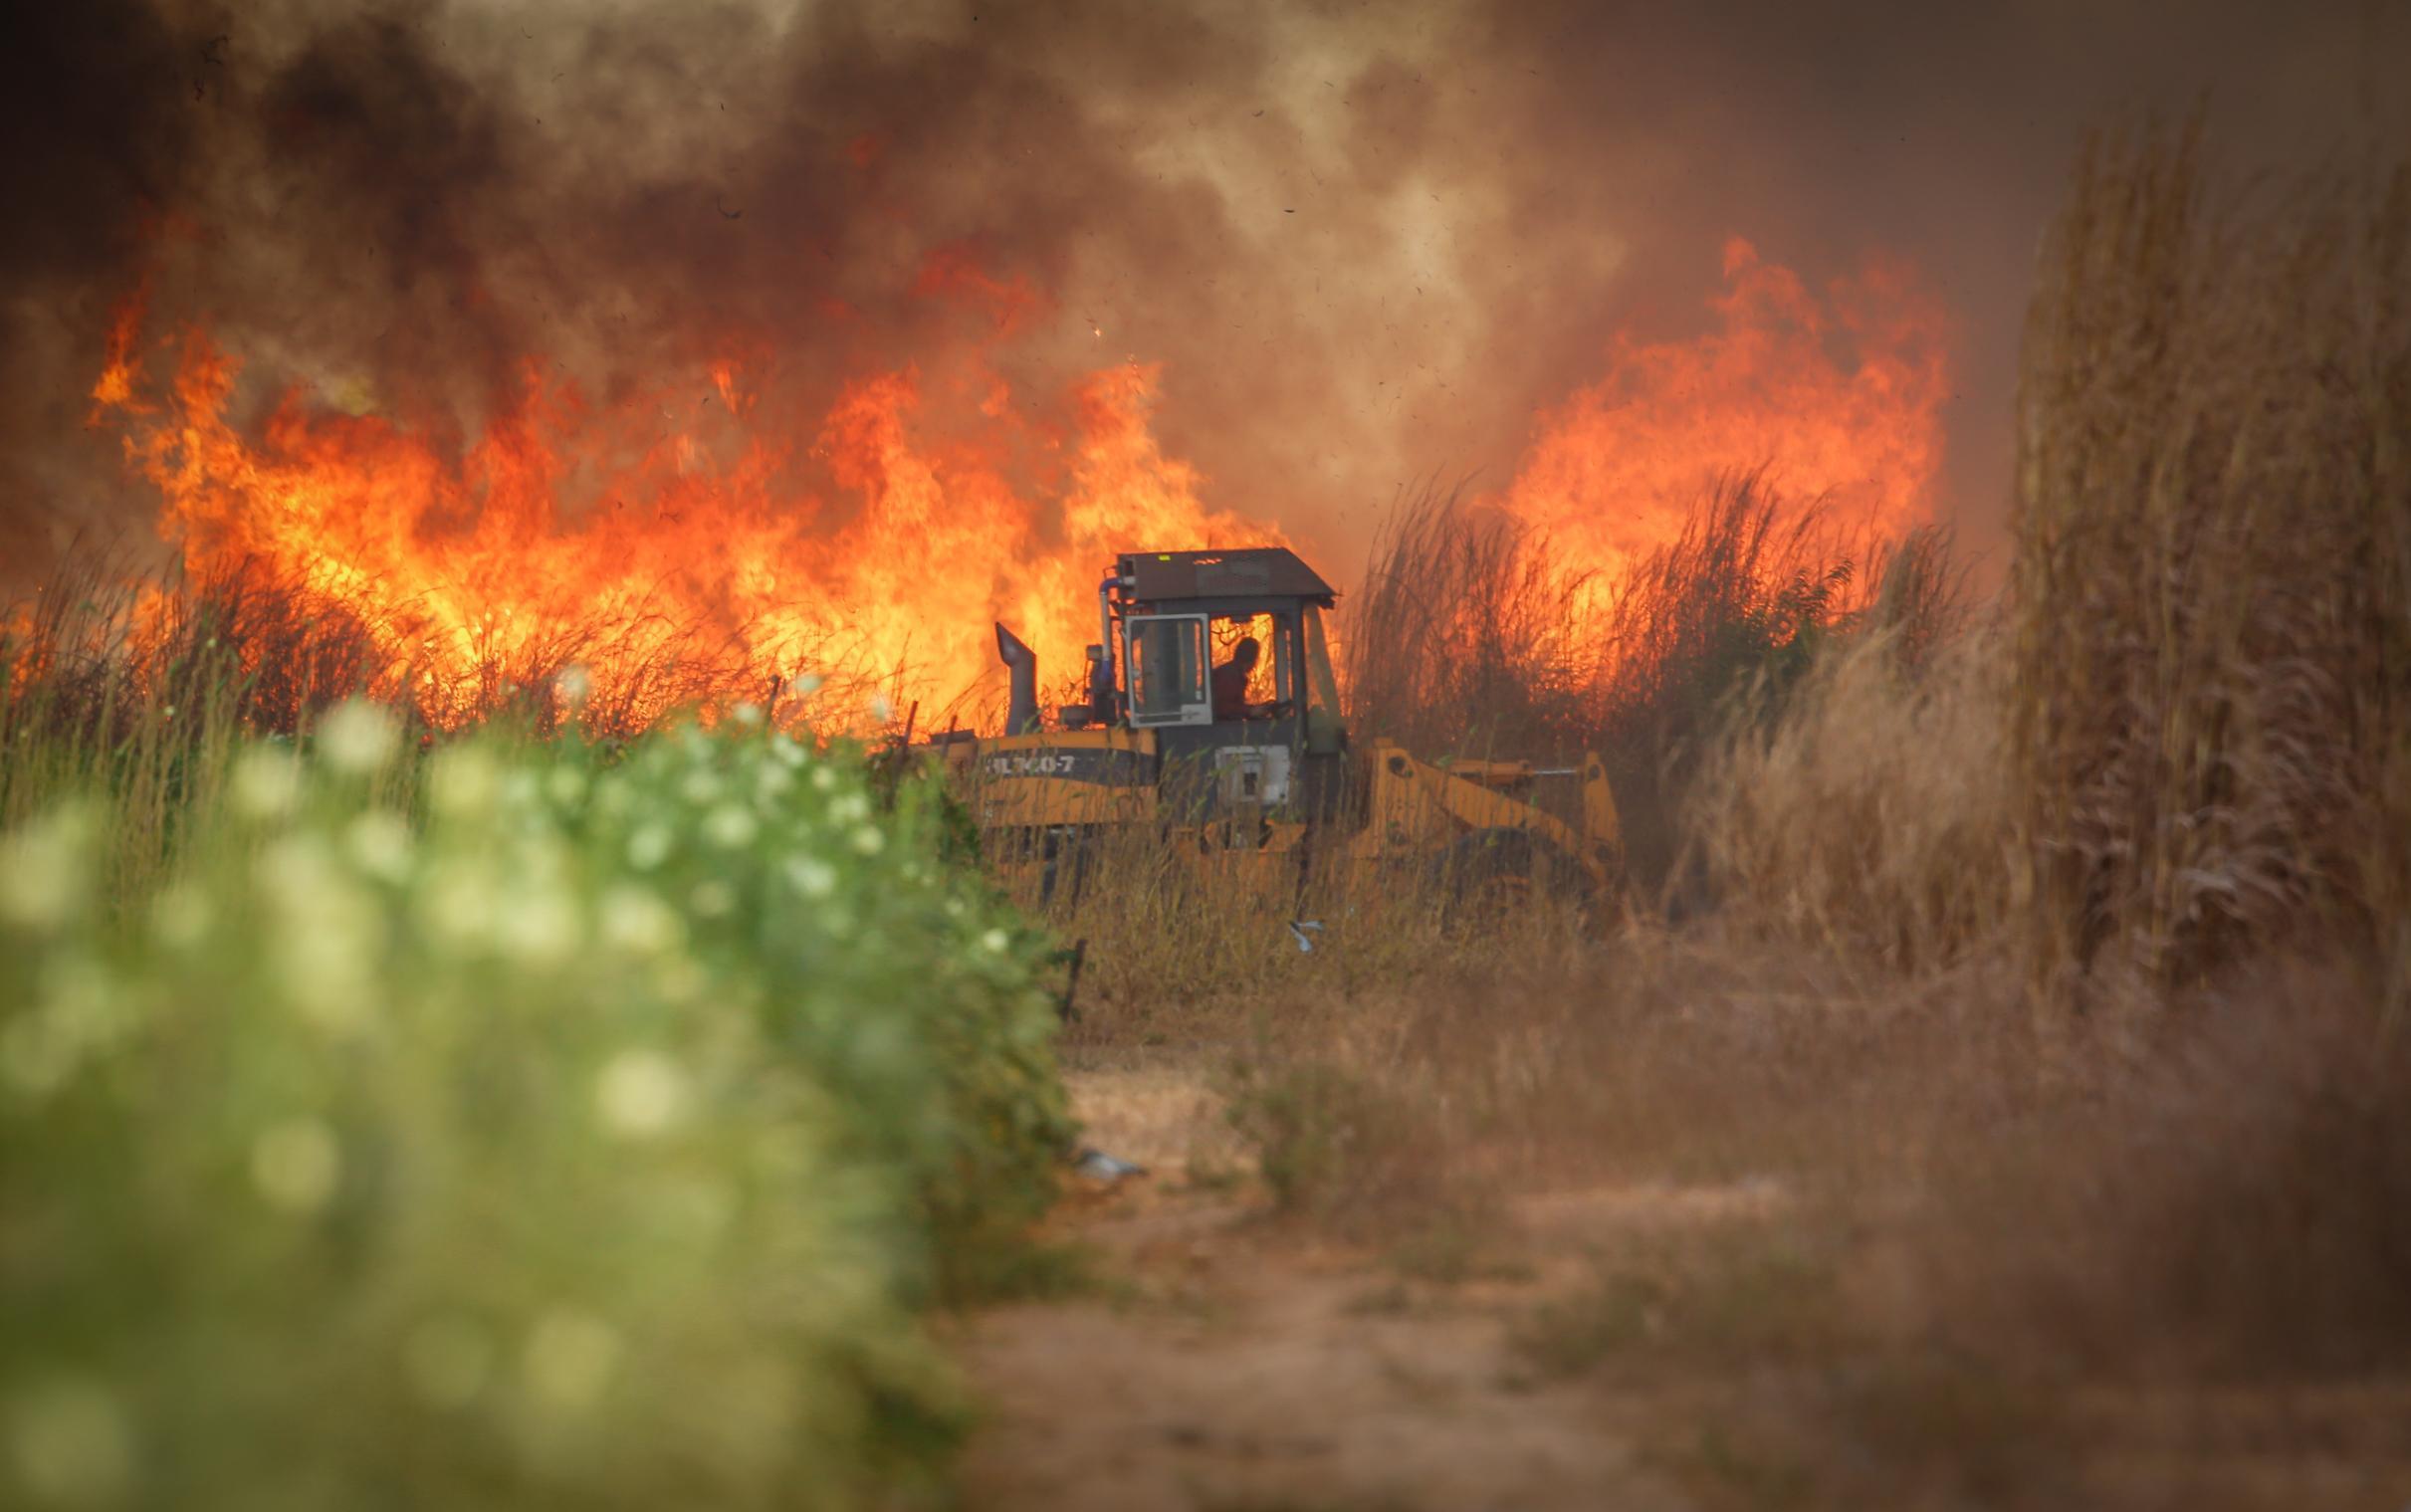
Invasive grass species can alter landscapes and their existing fire regimes. Photo by Glenn Campbell.
Research outputs
Factsheets
User guide
Presentation
Project webpage
Attributions
We would like to acknowledge the support and input provided by Bob Pressey, Erin Graham and Jeremy VanderWal (James Cook University), and Vanessa Adams (University of Tasmania). We could not have completed such an ambitious project without their invaluable input.
We are also grateful to Michael Douglas, Brendan Edgar, Jane Thomas and Clare Taylor from the Northern Australia Environmental Resources Hub, whose expertise, professionalism, and support have resulted in the success of this project.
This project has been completed in close collaboration with various universities, government departments and non-government organisations. We would, therefore, like to extend our thanks to all of our co-investigators and contributors, especially Ian Cowie, Alaric Fisher, Graeme Gillespie, Damian Milne (Northern Territory Government), Arthur Georges (University of Canberra), Jayden Engert, Mark Hamann, Donald McKnight, Jason Schaffer, Collin Storlie (James Cook University), Ashley Field, Mel Greenfield (Australian Tropical Herbarium, James Cook University), Miles Nicholls, Dave Westcott (CSIRO), David Pannell, Julian Tonti-Filippini (University of Western Australia), Frank Koehler (Australian Museum Research Institute), John Neldner (Qld Herbarium), Stephen Garnett, Peter Kyne, John Zichy-Woinarski (Charles Darwin University), Brad Ellis, Peter Johnson, Lindsey Jones (Qld Department of Environment and Science), Marcus Baseler (Australian Department of Climate Change, Energy, the Environment and Water), Mel Hardie (Victorian Biodiversity Atlas), Paul Gioia, Stephen van Leeuwen (WA Department of Biodiversity, Conservation and Attractions), and Terry Reardon (SA Museum), who have contributed to the development of robust methods, ensuring end-user adoption of outputs, contributed data and/or assisted with model vetting. The success of this ambitious project was enabled by your involvement.

![]()