Anna Pintor
James Cook University
Keywords: threatened species, IUCN, International Union for the Conservation of Nature, EPBC, Environment Protection and Biodiversity Conservation Act, marsupials, mammals, habitat change, climate change, sea level rise, protected species, species distribution, species distribution models, SDM, SDMs, altered river flow, altered fire regime, extinction, vulnerable, threatened, endangered, high-priority recovery areas, high priority, expert vetting, bilbies, bilby, gouldian finch, rare mammals, australian mammals, fire frequency, chinee apple, invasive species, weeds, invasive weeds, gamba grass, feral pigs, feral animals, ferals, chytrid fungus, overgrazing
This research generated four data sets:
Report
July 2022
Northern Hub Final Report 2021
Northern Australia Environmental Resources Hub. 2021. Northern Australia Environmental Resources Hub Final Report. Charles Darwin University, Darwin.
Video
August 2021
NESP Northern Hub wrap-up video
Impact Storie
May 2021
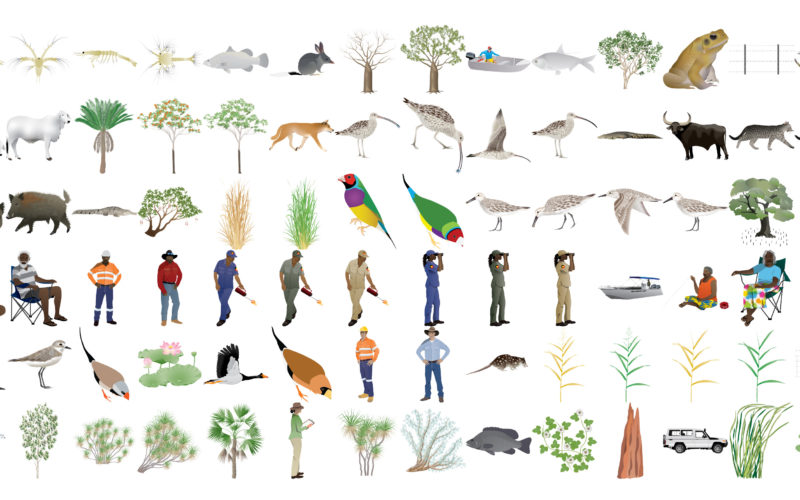
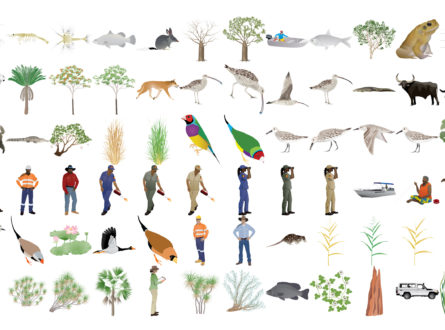
Engagement is a two-way street: Creating symbols for science communication (impact story 2020)
Other
March 2021
More Than Words (CSIRO Double Helix article Jan 2021)
Other
November 2020
NESP State & Territory showcase (2020)
Scientific Paper
July 2020
Big trouble for little fish: identifying Australian freshwater fishes in imminent risk of extinction (scientific paper)
Lintermans M, Geyle HM, Beatty S, Brown C , Ebner BC, Freeman R, Hammer MP, Humphreys WF, Kennard MJ, Kern P, Martin K, Morgan DL, Raadik TA, Unmack PJ, Wager R, Woinarski JCZ, & Garnett ST. 2020. Big trouble for little fish: identifying Australian freshwater fishes in imminent risk of extinction. Pacific Conservation Biology https://doi.org/10.1071/PC19053
Info Sheet
June 2020
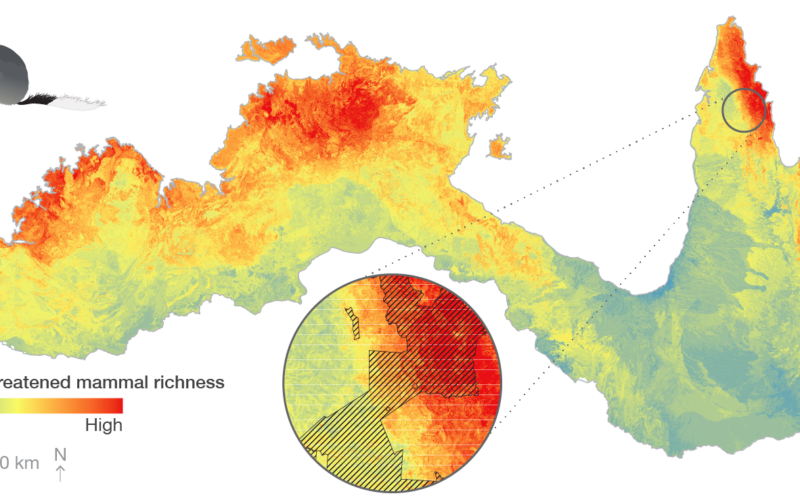
Prioritising threatened species in northern Australia (wrap-up factsheet)
Other
April 2020
Prioritising threatened species and threatening processes across northern Australia: User guide for data
Impact Storie
June 2019
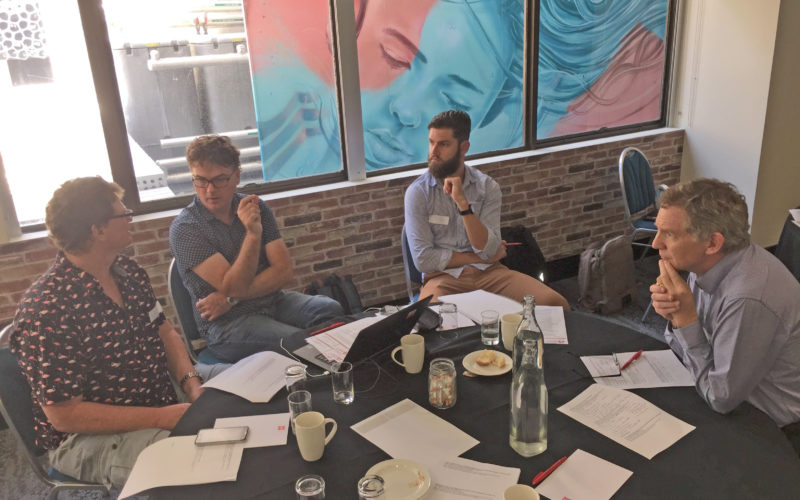
Telling our stories face to face (impact story)
Impact Storie
June 2019
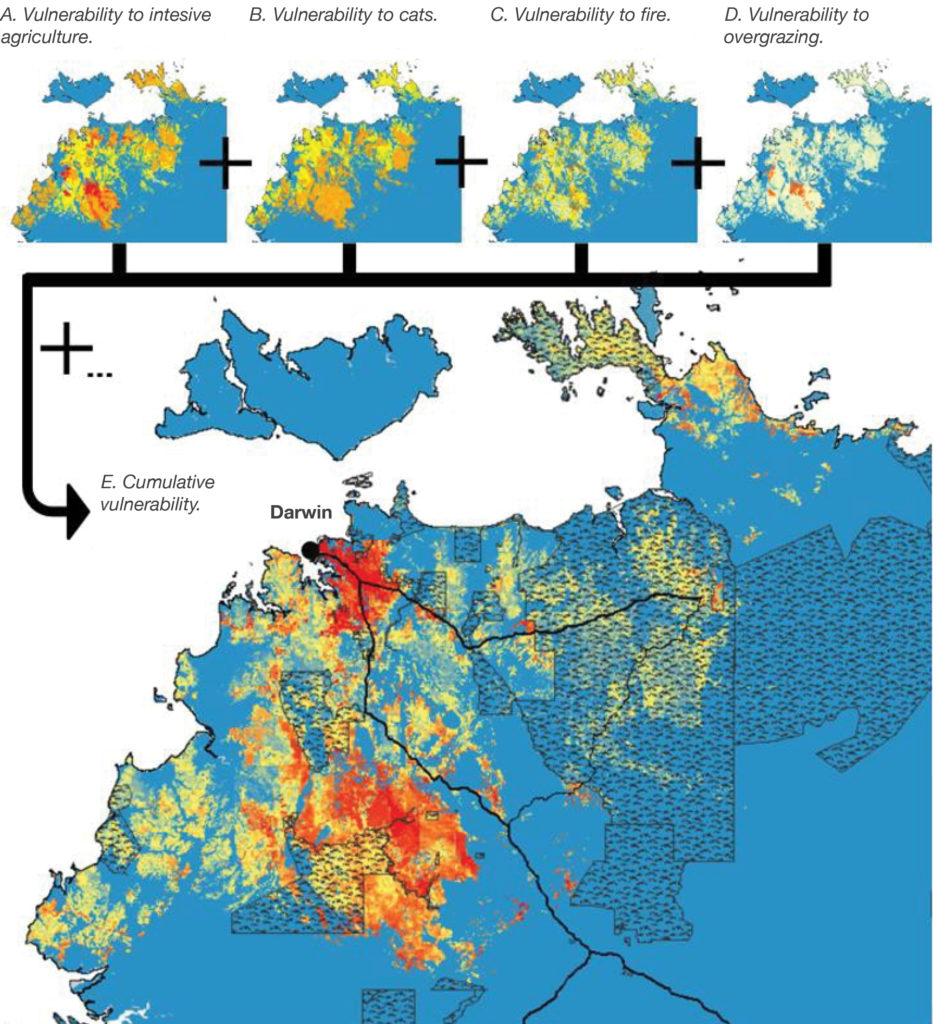
Modelling and mapping for conservation outcomes across the north (impact story)
Video
May 2019
NESP 2019 Canberra Forum summary (Feb 2019 video)
Video
April 2019
Prioritising threatened species of northern Australia – Anna Pintor (video Feb 2019)
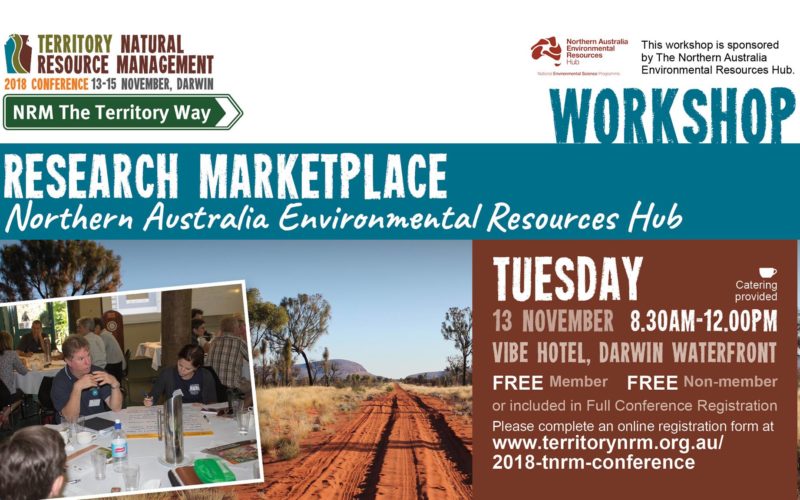
Presentation
February 2019
Prioritising threatened species in northern Australia (presentation Feb 2019)
Info Sheet
October 2018
Prioritising threatened species in northern Australia (project update Oct 2018)
Other
May 2017
West Kimberley research overview (brochure Jun 2018)
Other
May 2017
Top End research overview (brochure Jun 2018)
Other
May 2017
North Queensland research overview (brochure Mar 2019)
Info Sheet
November 2016
Prioritising threatened species in northern Australia (start-up factsheet)
| Public data |
| Plots |
| Supplementary |
Publicly accessible data is available via the link above.
Access to some data is restricted due to the sensitive nature of some of the information. Please refer to the User Guide which outlines which data is private and why.
You can request access to any of the full data sets. Please contact the Research Data JCU team by email with a detailed description of the data you are requesting. Please note that some restricted data requires approval from the relevant state, territory or federal government agencies.
The project was led by Dr Anna Pintor from James Cook University (JCU) and Associate Professor Mark Kennard from Griffith University, assisted by Stephanie Hernandez from JCU.
Dr Pintor was supported by researchers from JCU, the Australian Government’s Environmental Resources Information Network, The University of Western Australia, Griffith University, University of Tasmania, Northern Territory Department of Environment & Natural Resources, Western Australia Department of Biodiversity, Conservation & Attractions, Queensland Department of Environment & Science, and the Wet Tropics Management Authority.
We would like to acknowledge the support and input provided by Bob Pressey, Erin Graham and Jeremy VanderWal (James Cook University), and Vanessa Adams (University of Tasmania). We could not have completed such an ambitious project without their invaluable input.
We are also grateful to Michael Douglas, Brendan Edgar, Jane Thomas and Clare Taylor from the Northern Australia Environmental Resources Hub, whose expertise, professionalism, and support have resulted in the success of this project.
This project has been completed in close collaboration with various universities, government departments and non-government organisations. We would, therefore, like to extend our thanks to all of our co-investigators and contributors, especially Ian Cowie, Alaric Fisher, Graeme Gillespie, Damian Milne (Northern Territory Government), Arthur Georges (University of Canberra), Jayden Engert, Mark Hamann, Donald McKnight, Jason Schaffer, Collin Storlie (James Cook University), Ashley Field, Mel Greenfield (Australian Tropical Herbarium, James Cook University), Miles Nicholls, Dave Westcott (CSIRO), David Pannell, Julian Tonti-Filippini (University of Western Australia), Frank Koehler (Australian Museum Research Institute), John Neldner (Qld Herbarium), Stephen Garnett, Peter Kyne, John Zichy-Woinarski (Charles Darwin University), Brad Ellis, Peter Johnson, Lindsey Jones (Qld Department of Environment and Science), Marcus Baseler (Australian Department of Agriculture, Water and the Environment), Mel Hardie (Victorian Biodiversity Atlas), Paul Gioia, Stephen van Leeuwen (WA Department of Biodiversity, Conservation and Attractions), and Terry Reardon (SA Museum), who have contributed to the development of robust methods, ensuring end-user adoption of outputs, contributed data and/or assisted with model vetting. The success of this ambitious project was enabled by your involvement.
The project team acknowledges Aboriginal and Torres Strait Islander Peoples as the traditional custodians of the lands across northern Australia where this research applies. We pay our respects to Elders of the past, present and future, and acknowledge their spiritual connection to Country. In particular, the authors would like to acknowledge the Bindal and Wulgurukaba Peoples of the Townsville region, and the Yugarabul, Yuggera, Jagera and Turrbal Peoples of the Brisbane region where the project team lives and works.
Strong links with the Threatened Species Recovery (TSR) Hub have been formed to deliver this research. The project closely aligns with a series of TSR and Northern Hub projects, and promotes sharing of data and expertise among the Hubs.
This project was completed in 2019.
Contact
Stephanie Hernandez, James Cook University
stephanie.hernandez@jcu.edu.au
Anna Pintor, James Cook University
anna.pintor1@jcu.edu.au
James Cook University
James Cook University
Research Executive Committee and Eastern Node Leader
Griffith University
James Cook University
Key Researcher
The University of Western Australia
James Cook University
James Cook University
Research Executive Committee and Southern Node Leader
University of Tasmania