Jane Thomas
Knowledge Broker and Science Communicator
The University of Western Australia
A free collection of more than 250 graphical symbols has been developed to better represent northern Australia in science communication products. Initially conceived and developed for use by Hub research projects – where the symbols are effectively delivering research messages to key partners and end-users – they have also been released publicly and are being taken up in diverse fields and in exciting and unexpected ways. The range and diversity of symbols, including plants, animals, people, land uses, livelihoods and aspirations, are fostering inclusive two-way communication and better representing the landscapes and stories unique to northern Australia.
Central to the successful uptake of research by users is effective science communication that delivers research findings in ways that are accessible and easy to understand. Visual communication approaches can both bring the people and landscapes of northern Australia to life for decision-makers ‘down south’, and create engagement materials that are credible and realistic for local people. With a large Indigenous population and dozens of different languages spoken across northern Australia, visual methods are also an important tool to facilitate cross-cultural, two-way communication.
A new collection of more than 100 graphical symbols, created by the Hub, is achieving this and more.
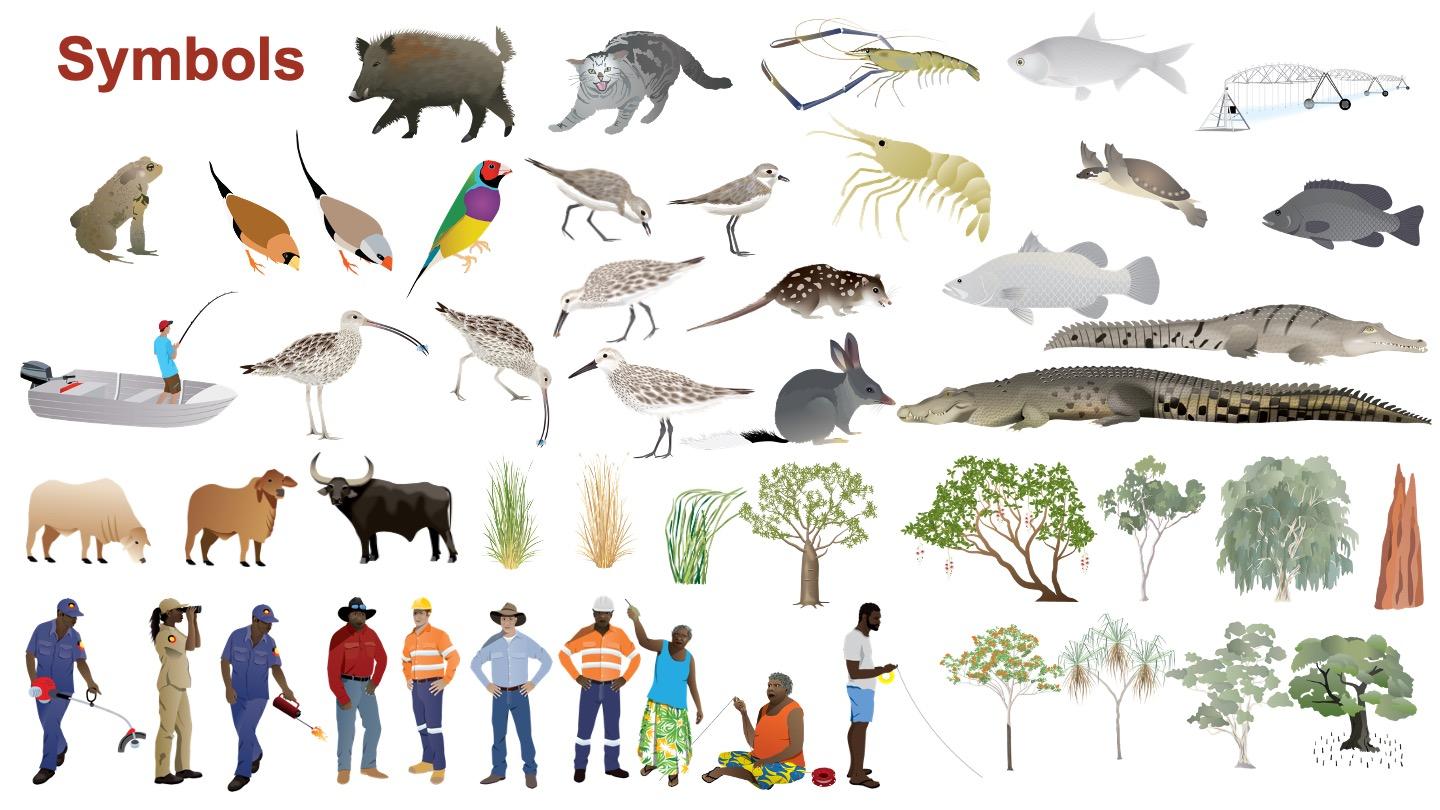
More than 100 symbols were created that can be used to tell the stories of northern Australia. Image: NESP Northern Australia Hub.
The use of symbols in science communication has been pioneered by the Integration and Application Network in the USA – its collection of nearly 3,000 symbols has been downloaded almost 100,000 times – but there was a distinct lack of appropriate and representative symbols specific to northern Australia.
Our new collection of symbols includes a range of people, plants, animals and activities that are instantly recognisable and familiar to people of northern Australia, to enable us to better tell the stories of our research in the region.
Symbols can be considered the building blocks for telling visual stories in the form of conceptual diagrams and other applications. They can help communicate about northern Australia in ways that are independent of spoken or written language, and that tap into ancient creative expression using art, symbols and storytelling.
Another advantage of the symbols is that they’re relatable and representative without being too specific. Symbols and diagrams can be used instead of photographs that may show identifiable Indigenous people or sacred sites – photos which can be culturally unsafe and inappropriate to use in communication materials intended for engagement with many Indigenous audiences.
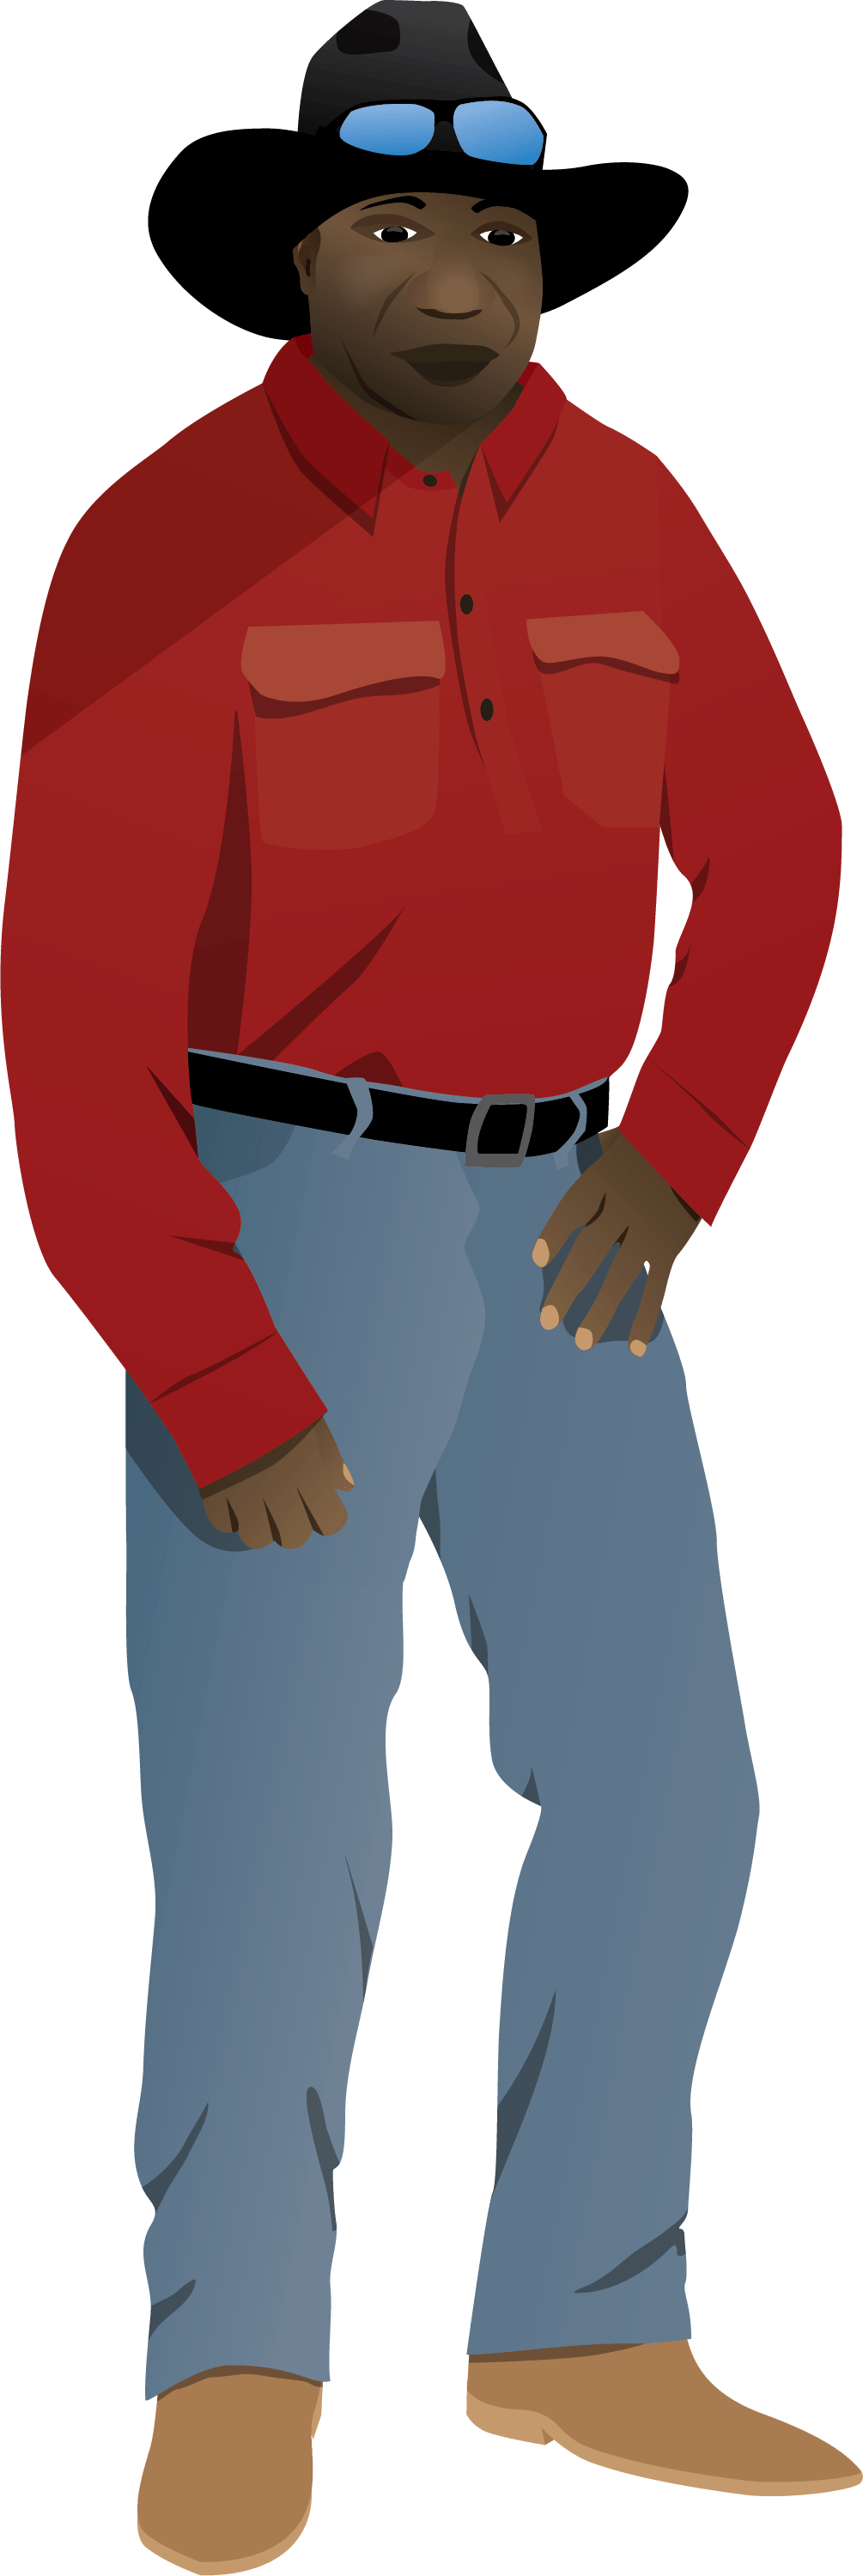
The symbols were conceived and developed on an as-needed basis for Hub projects, such as the feral pig symbol for the Defining metrics of success for feral animals project, and people in different livelihoods – such as an Indigenous ranger and pastoralist – for the Multi-objective scenario planning in northern Australia project. Symbols, and diagrams incorporating them, were provided to Hub project leaders and research teams who have been using them in presentations, journal articles, reports and other communication products.
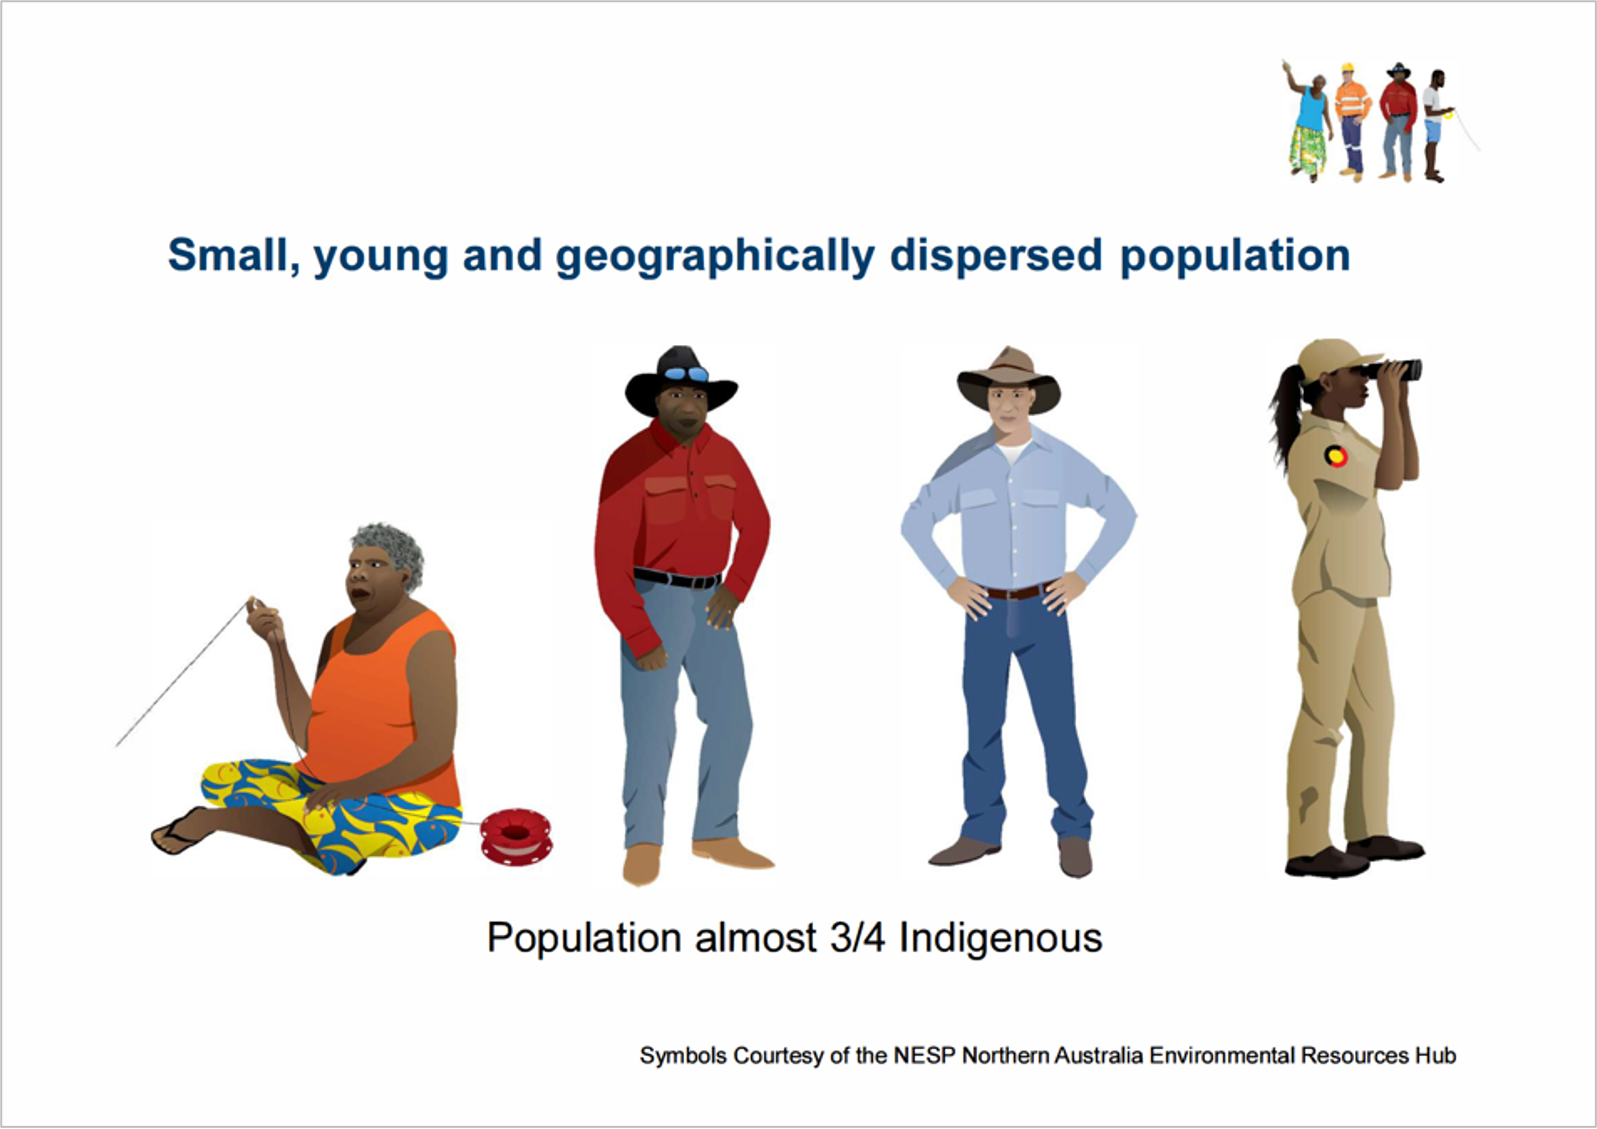
Before public release, the symbol collection – particularly the symbols of Indigenous people – was refined and expanded after consultation with Professor Stephen van Leeuwen, Noongar man, Curtin University Indigenous Chair for Biodiversity and Environmental Science, and Hub Research Executive Committee member. His advice was to make the people symbols more well-rounded by including symbols of multiple generations of Indigenous people (children and Elders) that represent families being together, being on Country, sharing knowledge and general wellbeing.
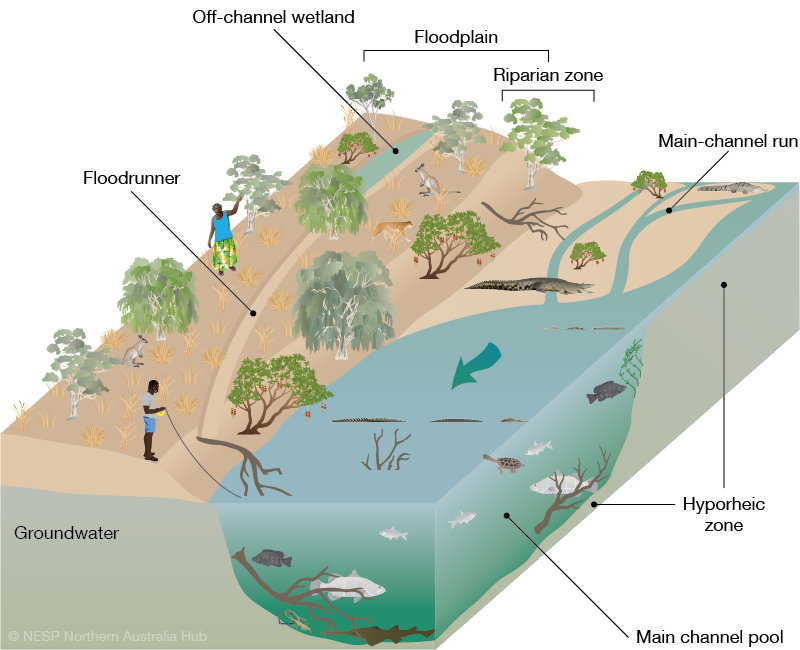
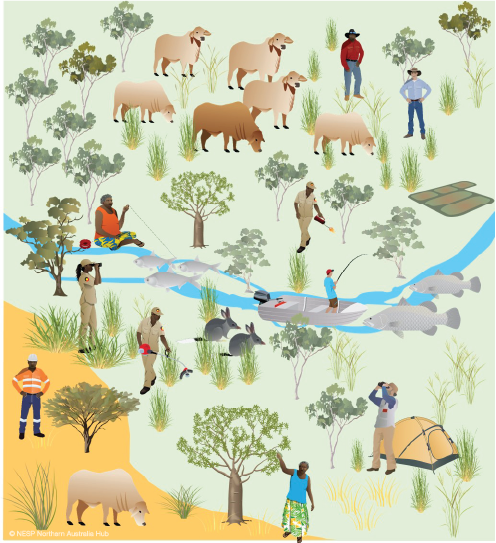
This diagram shows the different hydrological zones of the Fitzroy River in Western Australia. Including people in the diagram, rather than just animals and plants, recognises that humans have lived in the landscapes of northern Australia for millennia. Image: NESP Northern Australia Hub.
There are more than 25 different Indigenous words for bilby … A picture really is worth a thousand words. The symbols are a more powerful method of communication. For many mobs, English is a third or fourth language. We can use symbols to get stories across far better than text. It’s communication without words. It really unlocks the flow and interchange of knowledge … It’s about building relationships of trust, and two-way communication. It’s about being respectful to communities, Elders and kids. What are their aspirations? Their wants? Their messages?
– Professor Stephen van Leeuwen, Curtin University Indigenous Chair for Biodiversity and Environmental Science
Using the symbols in diagrams and animations communicates messages to key research users in visually attractive and easy-to-understand ways. This animation of foraging shorebirds, which is included in a research impact video, drew praise from senior government staff.
Using symbols and animations to communicate key findings of the Gulf rivers research beautifully illustrates the dynamic ecological relationships and inter-dependencies – for example, shorebirds and benthic mud-dwelling biota, and the important hydro-chemical processes driving productivity of these estuaries. Translating these complex concepts using symbols and diagrams brings this important research to a wider audience, recognising differing levels of water and ecological literacy and the need to make this new knowledge accessible to the diverse sectors and communities in these catchments.
– Ramsar National Focal Point, Australian Department of Climate Change, Energy, the Environment and Water
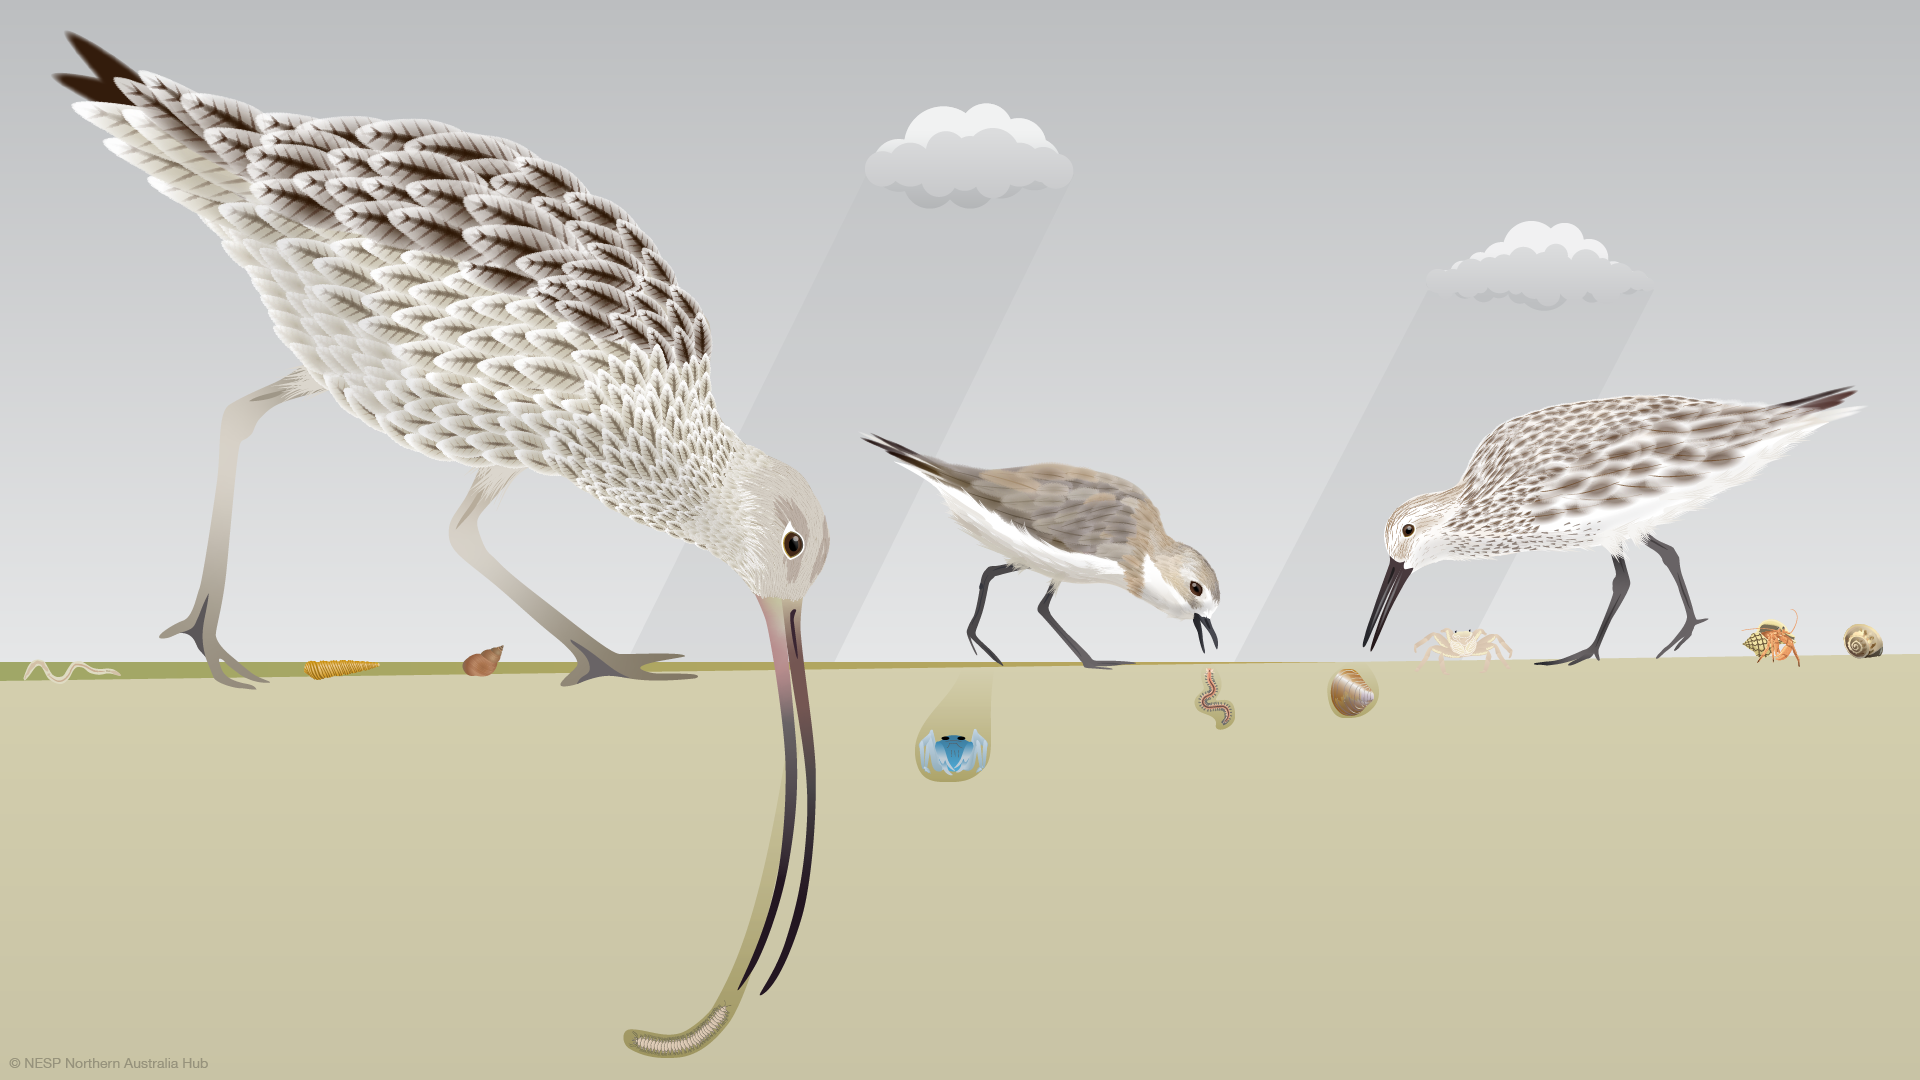
This diagram shows how migratory shorebirds are dependent on the mudflats and sandflats of the Gulf of Carpentaria to feed and fatten up for their long annual migrations. Image: NESP Northern Australia Hub.
These symbols were successfully used to communicate NESP Northern Hub research in the NT Oolloo Dolostone Aquifer Water Allocation Plan, by the WA government in their consultations with Traditional Owners in the Kimberley on the Fitzroy River Water Allocation Plan and Management Plan, and in several scientific papers published by hub researchers including this paper on ‘Conceptualizing hydro-socio-ecological relationships to enable more inclusive water allocation planning’.
As mentioned, the symbols were used in participatory scenario planning in Western Australia’s Fitzroy River catchment. This use of the symbols illustrates their power in facilitating authentic two-way communication, where participants feel respected and that their lives and aspirations are represented.
Participants in the NESP Fitzroy scenarios project (including Kimberley Traditional Owners and stakeholders) thought the images were useful to illustrate key elements of the catchment and key differences between scenarios.
– Dr Jorge Álvarez-Romero, Project Leader, James Cook University
Using the symbols in participatory scenario planning allowed participants to envision how alternative development futures might unfold, allowing stakeholders of the region to consider and discuss their perceptions and aspirations for the future. Image: NESP Northern Australia Hub.
The Western Australian government has used the symbols in community consultation materials around the Fitzroy River management plan. Image: Western Australia Department of Primary Industries and Regional Development.
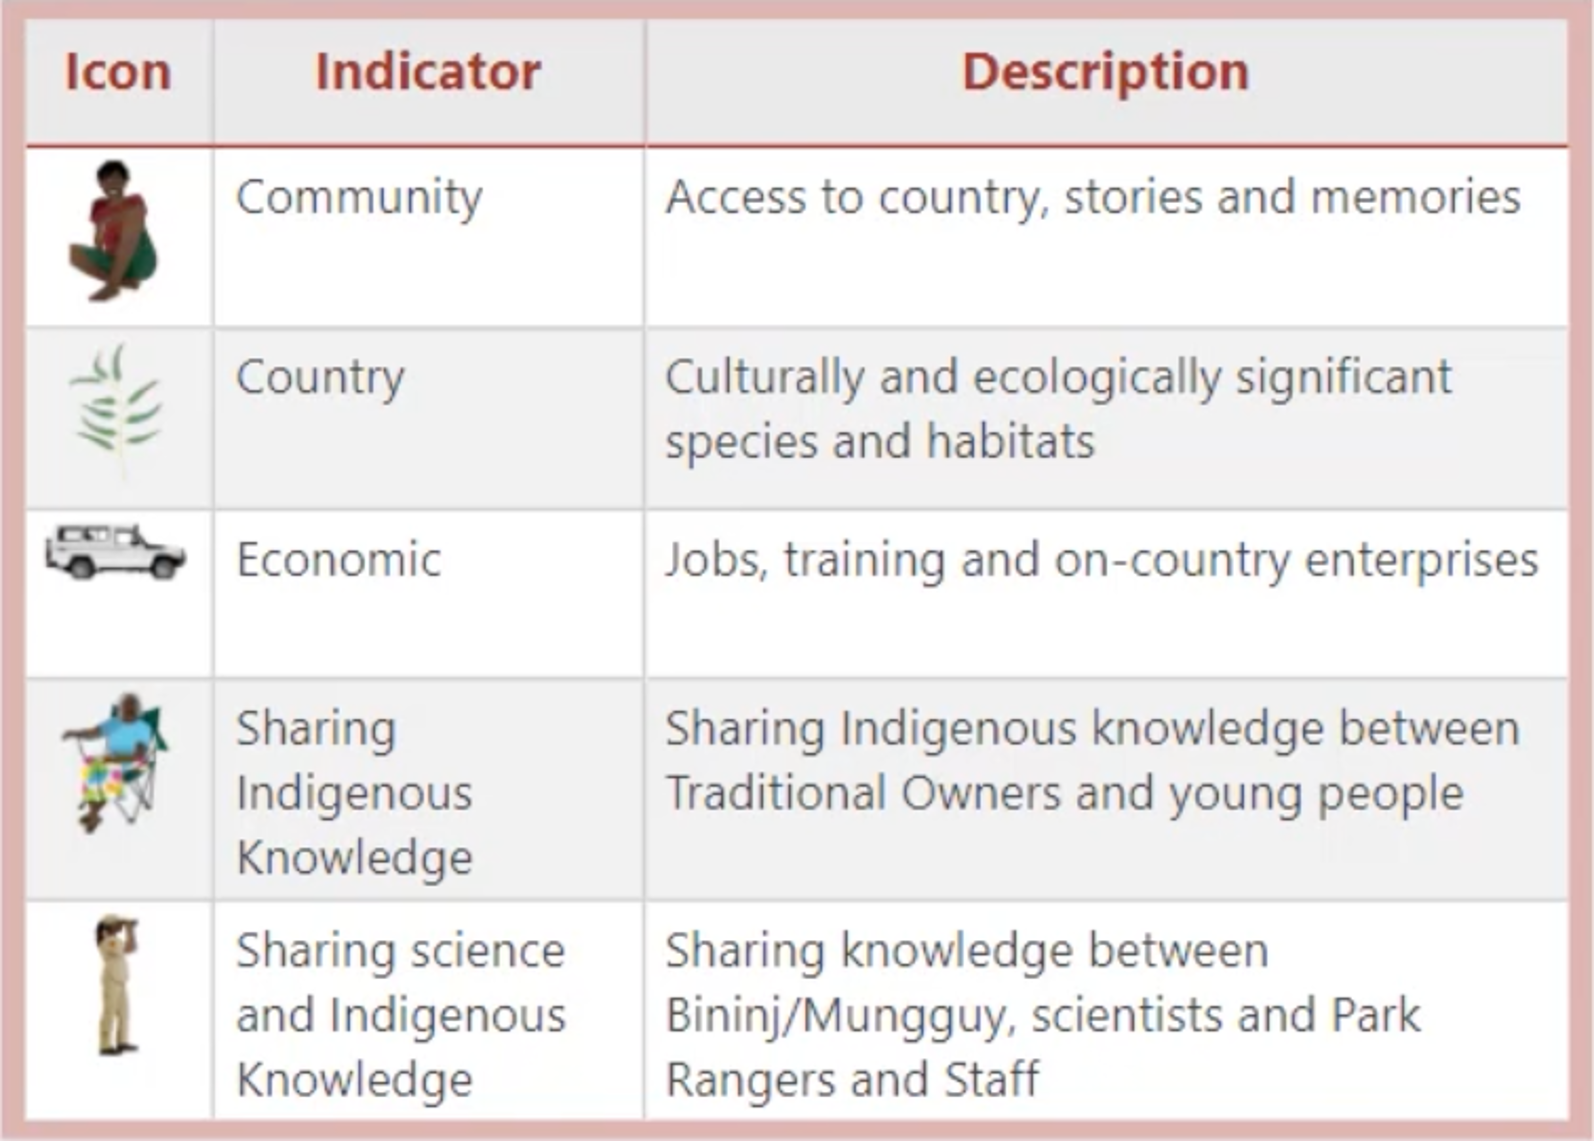
The symbols are being used in a digital dashboard that Traditional Owners and park rangers can use to assess and monitor sites in Kakadu National Park. Image: NESP Northern Australia Hub.
The subsequent public release of the symbols has resulted in more than 450 additional users registering for the symbols.
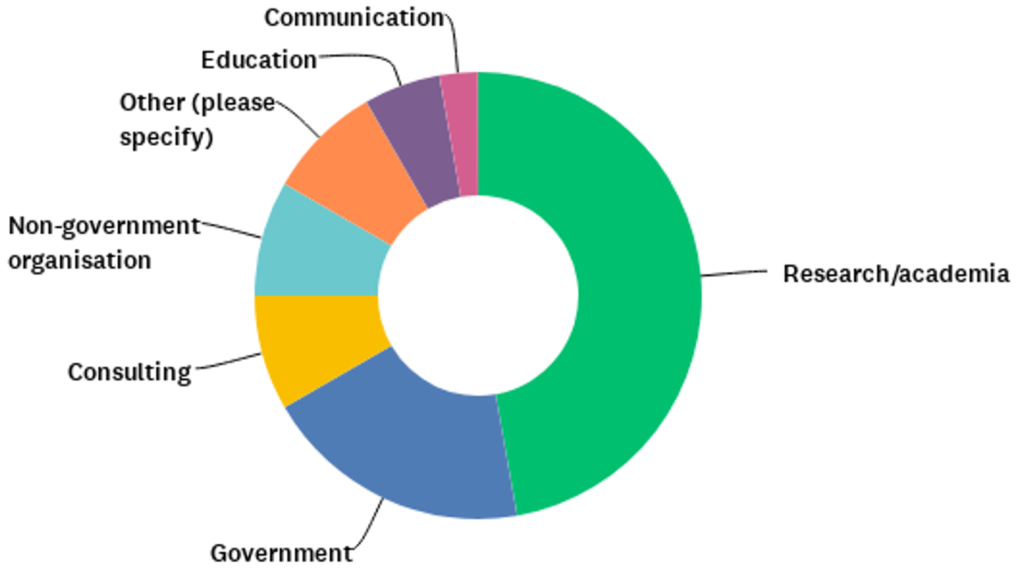
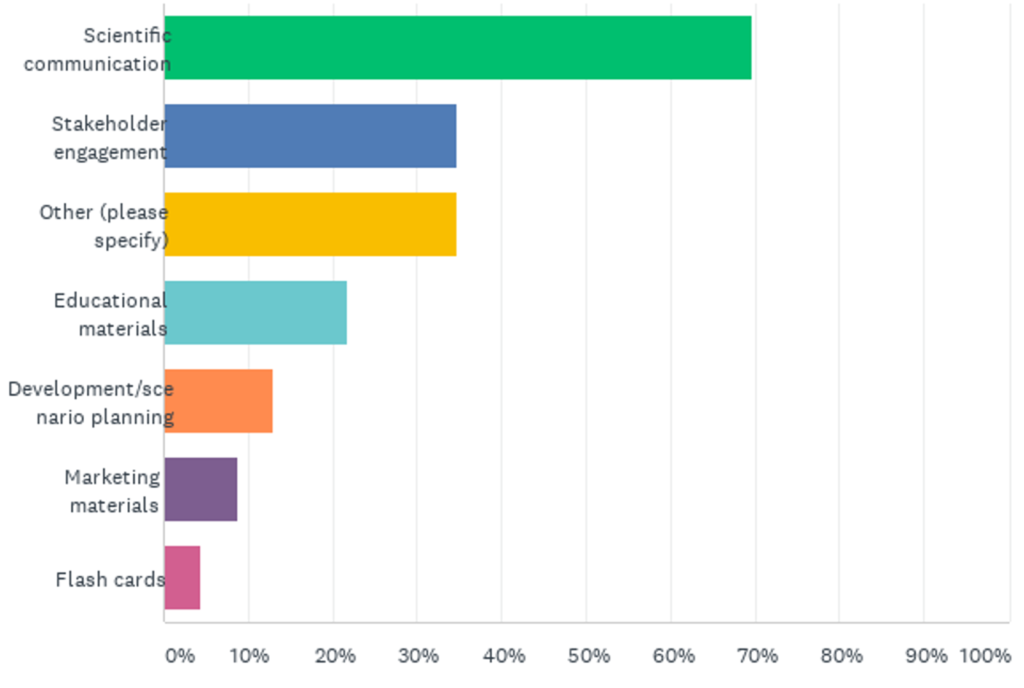
A Hub survey revealed that most symbol users work in research/academia and government, and the intended use is for scientific communication and stakeholder engagement, aligning with the Hub’s primary goal of making the symbols useful to our researchers and research users. All survey respondents said the symbols would be useful, very useful or extremely useful for their work.
 |
 |
|
Most users of the symbols work in research/academia or government. |
Most intended uses of the symbols are for scientific communication and stakeholder engagement. |
Hub science communication team members Jane Thomas and Patch Clapp gave a presentation about the symbols at the Australian Science Communicators conference in February 2020. The presentation stimulated a discussion in the session about the symbols and our approach, and multiple conference delegates approached Jane and Patch during the remainder of the conference to learn more.
The Facebook post launching the symbols had the highest reach of any Hub post in 2020, with 26,000+ people reached, ~4,500 engagements and 119 shares. The corresponding tweet was also the most popular tweet of 2020, with 25,400+ impressions and 2,000+ total engagements.
Interestingly (and unexpectedly), a significant number of symbol users identified as speech pathologists who work with Indigenous children and families – further evidence of how the symbols cut across language and cultural barriers.
Our clients love talking about going hunting and cooking up bush tucker. These symbols are a great stimulus for speech and language therapy activities.
– Feedback from speech pathologist symbol user
‘Symbolic gestures’ can often refer to actions that have little depth or meaning beyond face value. However, with the Hub’s development of symbols for northern Australia, we’re empowering researchers, research users and other interested communicators to translate science in cross-cultural settings to enable research to be communicated and used by stakeholders across northern Australia and beyond.
Research outputs using symbols
Scientific papers
Factsheets
Reports
Presentations (a selection)
Videos
Website posts
Media
Other outputs
Attributions
We acknowledge Aboriginal and Torres Strait Islander Peoples as the traditional custodians of the lands on which we work. We pay our respects to Elders of the past and present, and acknowledge their spiritual connection to Country. In particular we would like to acknowledge the Larrakia people of the Darwin region where the NESP Northern Australia Environmental Resources Hub was hosted.
Knowledge Broker and Science Communicator
The University of Western Australia
Deputy Hub Leader and Senior Indigenous Facilitator
Curtin University